Bubble Map Template
Map ideas and data points quickly with a Bubble Map Template. Streamline complex information, promoting efficient decision-making in every project across your organization.
Trusted by 65M+ users and leading companies


About the Bubble Map Template
The Bubble Map Template stands out in data visualization and idea organization as an adaptable and easy-to-use tool. It allows you to arrange your thoughts, processes, or data in a visually appealing and understandable format, boosting efficiency and clarity. Whether brainstorming, strategizing, or presenting, use the Bubble Map Template as your go-to solution for turning complex ideas into clear visual narratives.
What's a Bubble Map Template?
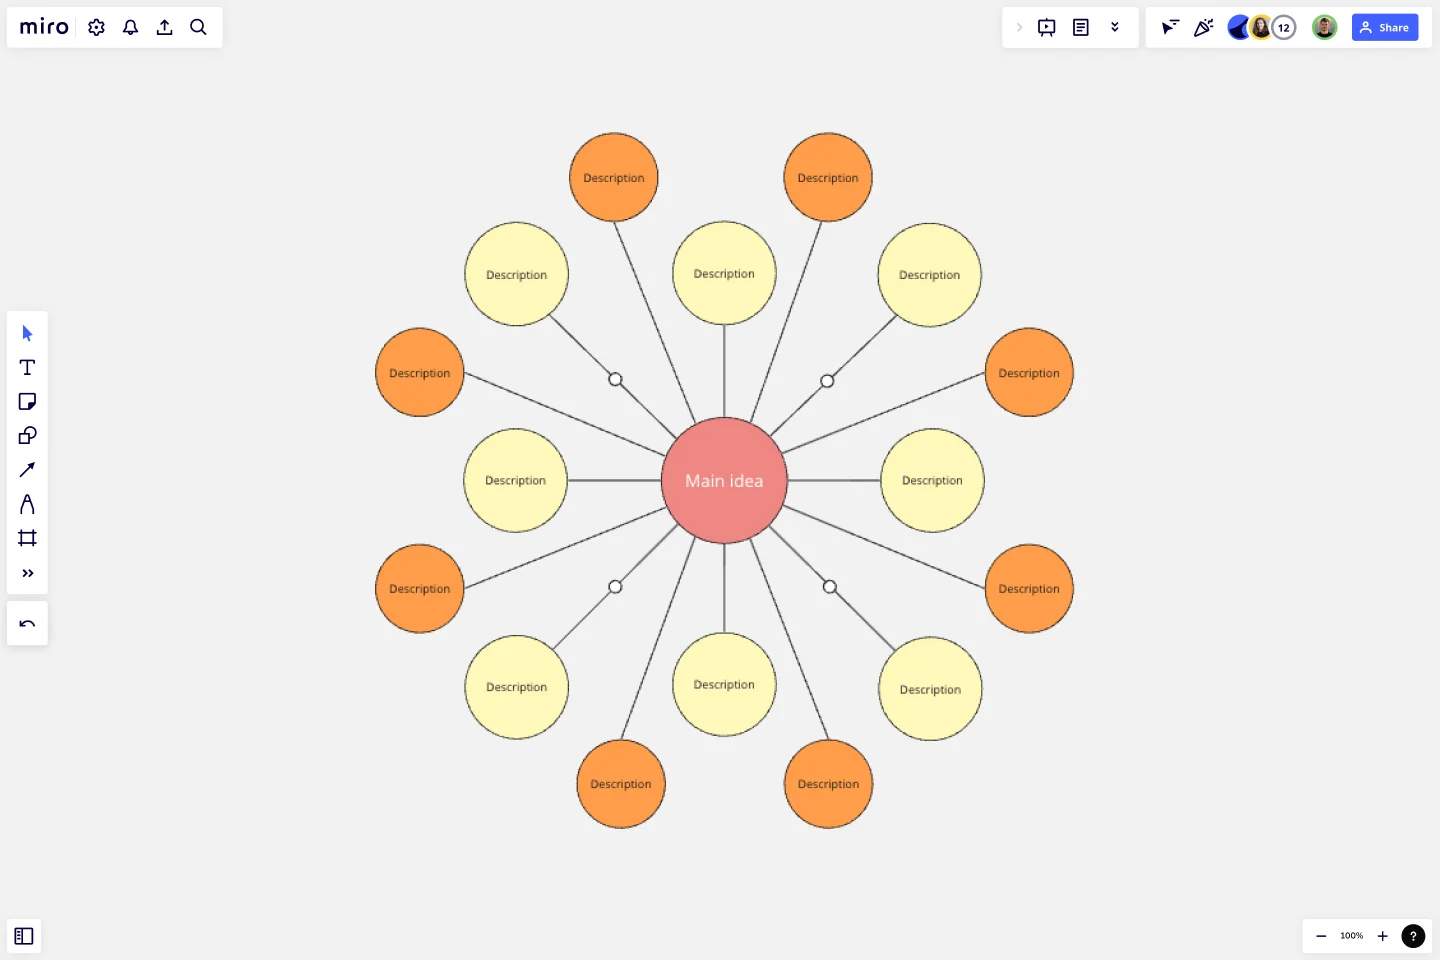
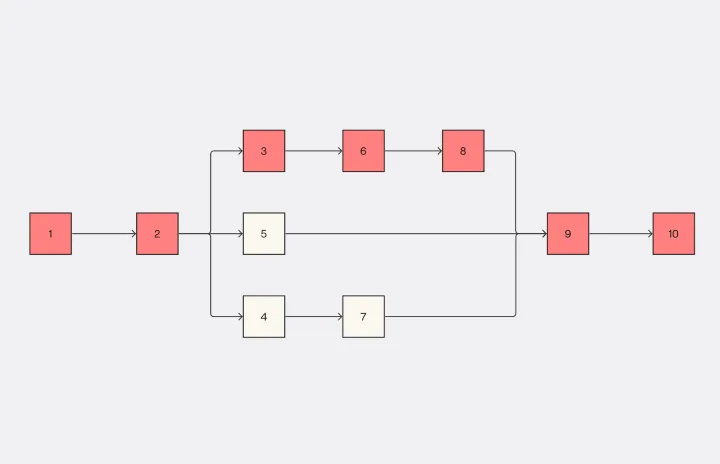
A Bubble Map Template is a diagramming tool used for visually organizing information. The diagram uses varying-sized circles or "bubbles" to represent concepts and lines to denote relationships or connections between them. It's a great tool for understanding complex systems, brainstorming ideas, or visualizing hierarchies and relationships.
Why should you use it?
Bubble maps help streamline thoughts, ideas, and information in an easily digestible format. They encourage critical thinking and facilitate understanding of relationships and patterns within complex data.
How to use a Bubble Map Template in Miro?
The Bubble Map Template in Miro offers a streamlined way to visually organize your ideas or data. Here's a quick guide to creating your Bubble Map:
Select the Bubble Map Template: Click on "Use template." The template will then be loaded onto your Miro board.
Edit the bubbles: Click on the template, and a text box will appear in the context menu bar. This will allow you to edit the central bubble or main idea. For resizing, click and drag the circle's edge. In the context menu, change the color of the bubbles and lines, adjust the font size and style within the bubbles, and even add icons or images to make your bubble map more visually engaging.
Auto-arrange and align: If you're dealing with many bubbles, Miro's auto-arrange and align feature can help you keep your map neat and readable.
Remember that you can invite others to collaborate on your bubble map in real-time, making it the ultimate bubble map maker and an excellent tool for brainstorming sessions, project planning, or team meetings. Enjoy visually mapping your thoughts and ideas with Miro's Bubble Map Template.
Can I collaborate with my team on a Bubble Map in real time?
Yes. Miro's collaborative features allow multiple users to work on the same Bubble Map simultaneously. Team members can add their input, make changes, and leave comments in real time, promoting dynamic and efficient collaboration.
Can I share my Bubble Map with others?
Absolutely. Miro lets you share your Bubble Map in several ways – via a link, email, or even embedded on a website. You can control whether recipients can view, comment or edit your map.
Can I use the Bubble Map Template offline?
Miro primarily operates online to enable real time collaboration. However, you can export your Bubble Map Template as a PNG, JPEG, or PDF file to view offline.
Get started with this template right now.
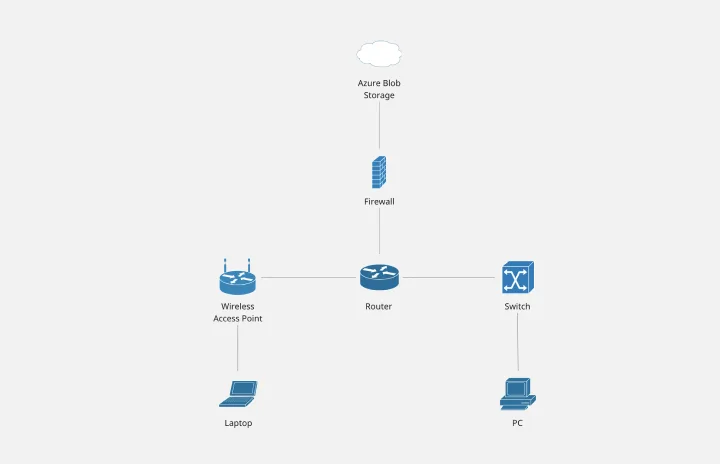
Cisco Network Diagram Template
Works best for:
Software Development, Diagrams
Cisco offers data center and access networking solutions built for scale with industry-leading automation, programmability, and real-time visibility. The Cisco Data Network Diagram uses Cisco elements to show the network design of Cisco Data Networks visually.

Driver Diagram Template
Works best for:
Diagramming
The driver diagram template is a strategic visual tool that helps teams map out their primary objectives and break them down into actionable components. It presents goals, drivers, and specific change ideas in a coherent and interconnected format, ensuring clarity of objective. By doing so, every team member is aligned towards a common endpoint, fostering unified efforts. The visual nature of the template simplifies complex objectives, making it easier for teams to stay on track and measure their progress effectively.
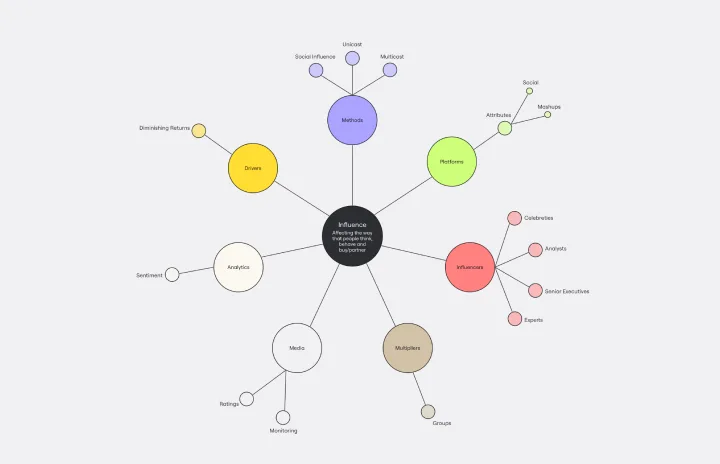
Cluster Diagram Template
Works best for:
Diagramming
The Cluster Diagram Template is a valuable tool for organizing and connecting ideas, concepts, and information in a visually compelling and coherent manner. The template's design centers on grouping related ideas around a core concept, creating a transparent and hierarchical structure. This clustering not only aids in breaking down complex information into manageable segments but also significantly enhances the process of idea generation and brainstorming. A structured yet flexible visual framework encourages deeper engagement and more precise understanding, making it an essential asset for teams and people looking to bring order to their creative and analytical processes. I have checked the text for any potential spelling, grammar, and punctuation errors, and it's good to go.
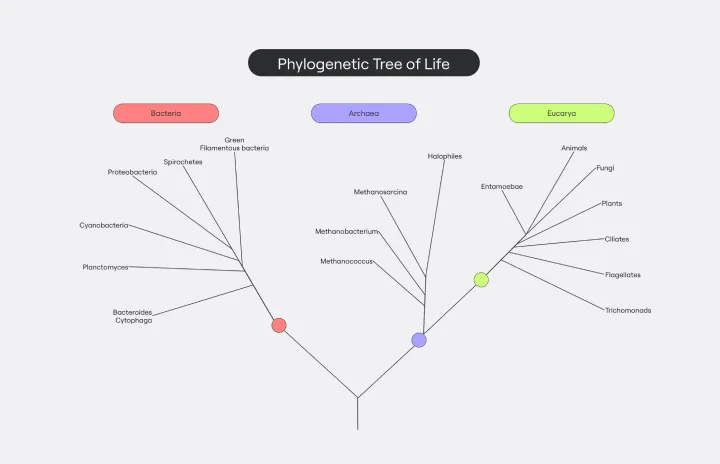
Phylogenetic Tree Template
Works best for:
Diagramming
The Phylogenetic Tree Template is a powerful tool that allows scientists and researchers to visualize evolutionary relationships between species. It is a visual representation of the history of the evolution of life on Earth and helps users identify the relationships between other organisms and their ancestors. The key benefit of this template is that it organizes complex data and makes it more understandable to everyone. Additionally, it offers an efficient way to collect and analyze data, saving time and effort and enabling users to identify significant patterns and relationships in the data.

Onion Diagram Template
Works best for:
Diagramming, Mapping and Diagramming
The Onion Diagram Template is a distinct tool designed to visually represent layers of a specific concept, system, or process, akin to the layers of an onion. Each concentric layer of the diagram provides insights into a different aspect or phase of the topic at hand, moving from the core foundational element outwards to more peripheral components. One of the prime benefits of this template is its ability to offer hierarchical clarity. Users can immediately discern the importance, sequence, or interrelation of different elements within a system, facilitating enhanced comprehension and efficient decision-making.
Critical Path Method Template
Works best for:
Diagramming, Project Management
Elevate your project management game with the Critical Path Method Template—an indispensable tool that brings clarity and precision to your project timelines. The template instantaneously adjusts as you edit tasks and dependencies, ensuring that your critical path is consistently up-to-date. This capability not only simplifies the complex process of project scheduling but also empowers your team to proactively respond to evolving project dynamics, fostering adaptability and efficiency throughout the project lifecycle.