Driver Diagram Template
Easily map out your objectives and break them into actionable components using the driver diagram template.
Trusted by 65M+ users and leading companies


About the Driver Diagram Template
Add structure to projects using the driver diagram template to simplify complex objectives into understandable parts, ensuring a streamlined approach to achieving goals.
A driver diagram is a strategic visualization tool that delineates a main goal into its core contributors and actionable steps. Use this template to visualize and communicate the key drivers or factors that contribute to achieving a specific goal or outcome.
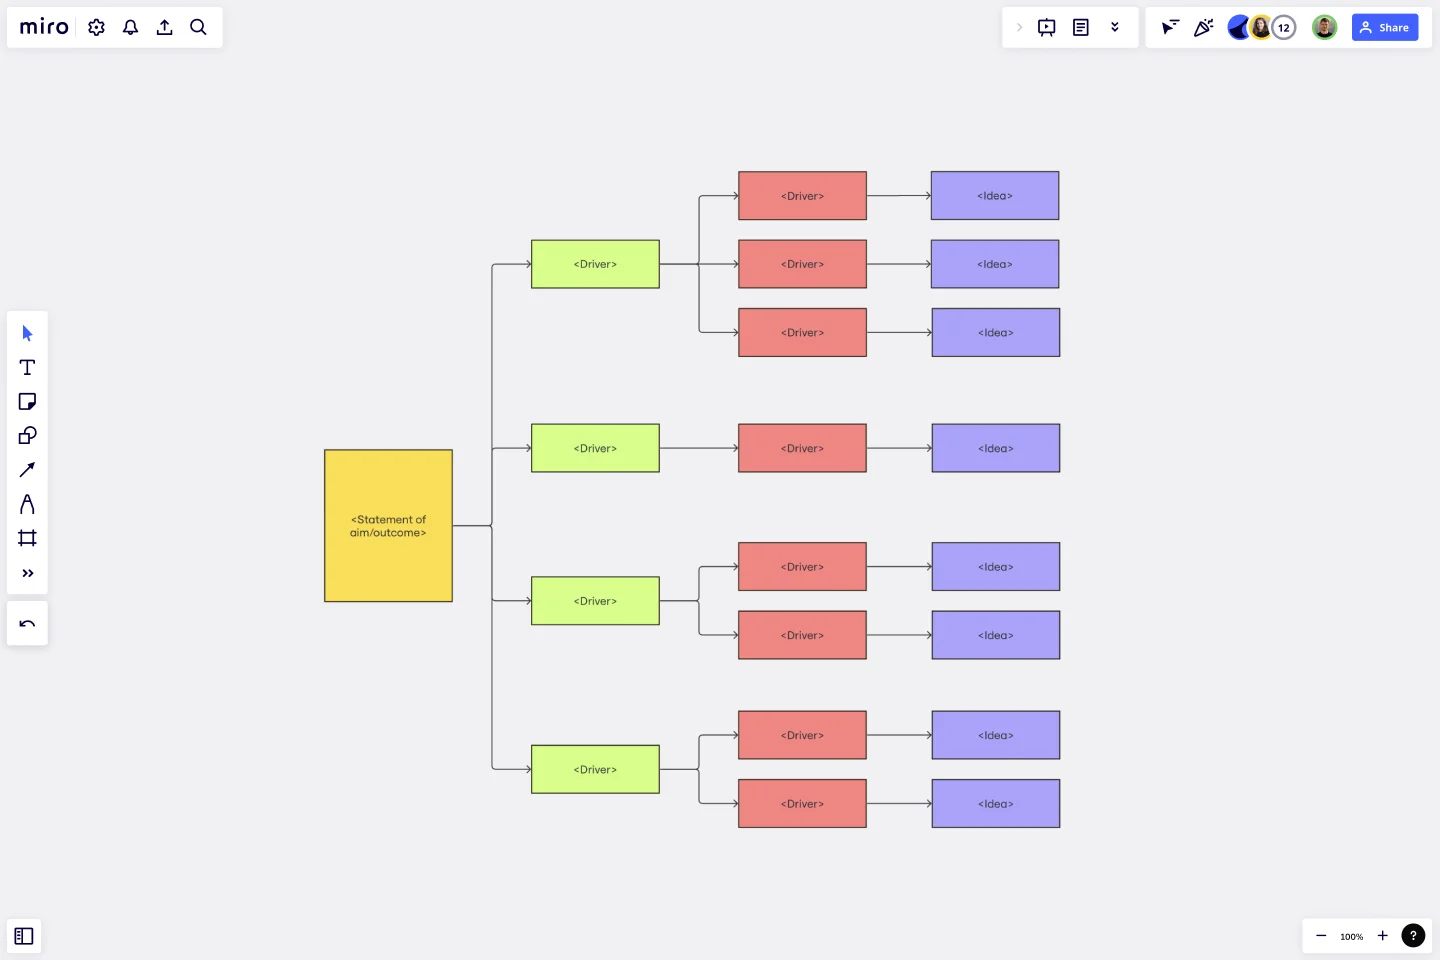
The template consists of three main areas:
Statement of aim/outcome: This is the heart of the diagram, indicating the ultimate objective or desired result.
Primary drivers: Directly stemming from the aim, these represent integral strategies or areas that are pivotal to achieving the overarching outcome.
Ideas: Branching out from each driver, these signify specific actions or initiatives that support the fulfillment of their respective drivers.
How to use the driver diagram template
The driver diagram template can be used to foster a shared understanding among team members, guide improvement efforts, and provide a structured approach to problem-solving and goal achievement. Here’s how to fill in the template to make it your own:
Add your primary aim: Starting with the "Statement of Aim/Outcome," define the primary goal or outcome that you want to achieve. This could be a desired improvement in a process, customer satisfaction, or any other measurable objective.
Expand your diagram: Edit the shapes and lines to add more drivers and connectors. Include secondary aims or sub-goals that are related to the primary aim. These secondary aims help break down the larger goal into more manageable components. Continue expanding the diagram to include drivers that directly impact the achievement of the secondary aims and, ultimately, the primary aim. Use arrows to indicate the relationships between different elements in the diagram.
Embed additional elements: Elevate the diagram by incorporating other elements, such as notes or reference images, to provide deeper context.
Why should you use a driver diagram template?
By visually representing the drivers and relationships, teams can better prioritize their efforts and focus on the most critical factors for success. Here are a few benefits the driver diagram template provides:
Visualization: Understand and define the cascade from overarching goals to specific actions.
Structured approach: Facilitate methodical planning by breaking down the goal into actionable steps.
Team collaboration: Encourage consistent understanding and teamwork towards a unified objective.
Efficient allocation: Allow for precise resource and time allocation based on priority and impact.
Track & refine: Filling in the driver diagram template makes monitoring progress and making necessary adjustments simpler.
If you'd prefer to start from scratch, diagramming with Miro is easy! You can choose from a wide range of diagramming shapes in Miro's extensive library, so you'll find just what you need.
Can I add more levels of ideas or drivers to the template?
Yes, the template is flexible and can be expanded to include additional layers or branches as your project needs.
How do I make the diagram more interactive?
Once you’ve added the driver diagram template to your Miro board, you have the option to add clickable links, annotations, and other interactive elements to enrich the user experience.
Can I color-code differently than what's shown?
Absolutely. The colors are customizable, allowing you to adapt based on preferences or significance.
Get started with this template right now.

Azure Demand Forecasting Template
Works best for:
Software Development, Diagrams
The Azure Demand Forecasting diagram will show the architecture of a demand forecast, making it easier for you to predict data consumption, costs, and forecast results. Azure is Microsoft’s cloud computing platform, designed to provide cloud-based services such as remote storage, database hosting, and centralized account management. Azure also offers new capabilities like AI and the Internet of Things (IoT).

Production Flowchart Template
Works best for:
Diagramming, Flowcharts
The Production Flowchart Template is a well-crafted tool that clearly represents a production process from start to finish. It breaks down complex procedures into easy-to-understand segments, making it easier for stakeholders to grasp the entire process. One of the key benefits of using this template is that it helps to clarify complex production pathways. By mapping out operations visually, teams can identify potential bottlenecks or inefficiencies, facilitating timely and well-informed decision-making.

Login Sequence Diagram Template
Works best for:
Diagramming, Technical Diagramming
The UML Sequence Login Diagram Template is a valuable tool for visualizing user authentication processes. It breaks down complex login sequences into clear, visual components, facilitating collaborative understanding among team members, regardless of their technical expertise. This shared understanding is crucial for ensuring all stakeholders, from developers to project managers, are on the same page, leading to efficient decision-making and a smoother development process. The template's ability to translate technical details into an accessible format streamlines communication and significantly reduces the likelihood of misinterpretation or oversight, making it an essential asset in any software development project.
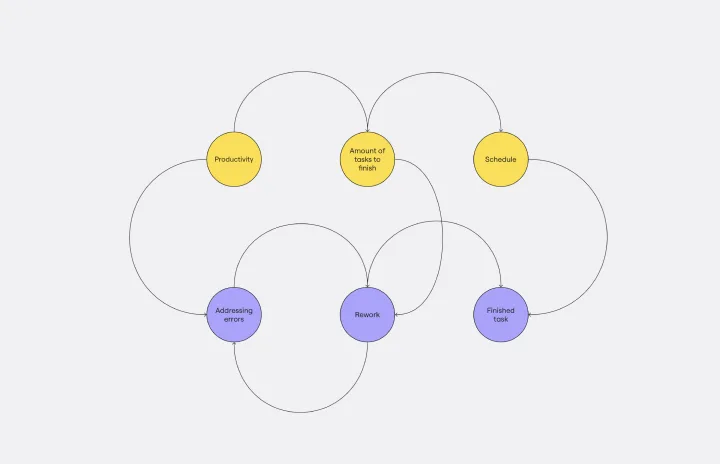
Causal Loop Diagram Template
Works best for:
Diagramming
The Causal Loop Diagram Template offers a structured framework to visualize the intricate interconnections within any system. Its standout benefit is the ability to provide a holistic perspective, ensuring that users don't just see isolated issues but understand the entire web of relationships, ultimately leading to more informed and strategic decision-making.
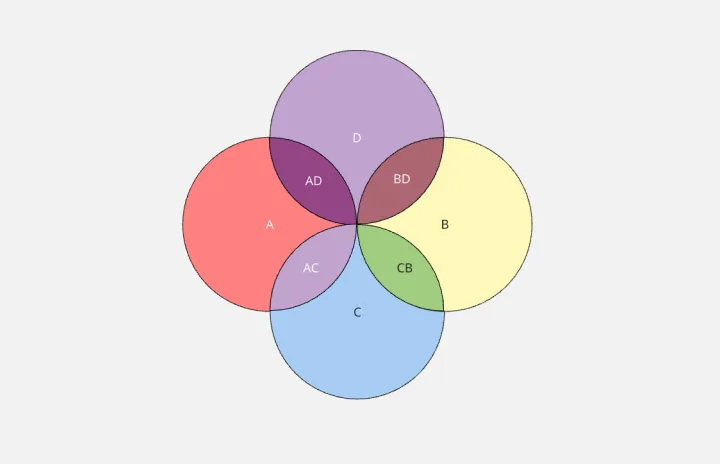
4-Circle Venn Diagram Template
Works best for:
Diagramming, Mapping, Brainstorming
The 4-Circle Venn Diagram Template has an easy, interactive, and dynamic way to visualize complex relationships between data sets. Empower your team's collaboration and communication with this powerful tool.
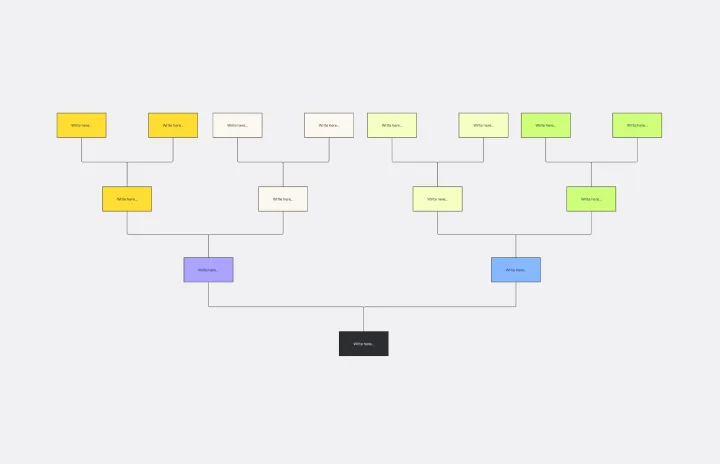
Tree Diagram Template
Works best for:
Diagramming
The tree diagram template helps you organize and present complex information. One of its key benefits is its ability to provide unparalleled visual clarity. It enables you to simplify complicated ideas into a structured, hierarchical format, making it easier to understand and communicate. This template enhances brainstorming sessions, project planning, and decision-making processes by mapping out relationships and dependencies clearly and effortlessly. You can now say goodbye to information overload and immerse yourself in a visual journey that simplifies complexity with the tree diagram template.