4-Circle Venn Diagram Template
Use the 4-Circle Venn Diagram Template to visualize complex relationships between data sets. Empower your team's collaboration and communication with this powerful tool today.
Trusted by 65M+ users and leading companies


About the 4-Circle Venn Diagram Template
The 4-Circle Venn Diagram Template is a powerful visual tool to help you effectively map out and explore different aspects of your concepts, ideas, or problems. Simplify complex information, create clear intersections, and foster better understanding by creating a 4-Circle Venn diagram. Whether you are brainstorming, analyzing data, or seeking overlaps between multiple elements, our 4-Circle Venn Diagram Template has got you covered.
What's a 4-Circle Venn Diagram Template?
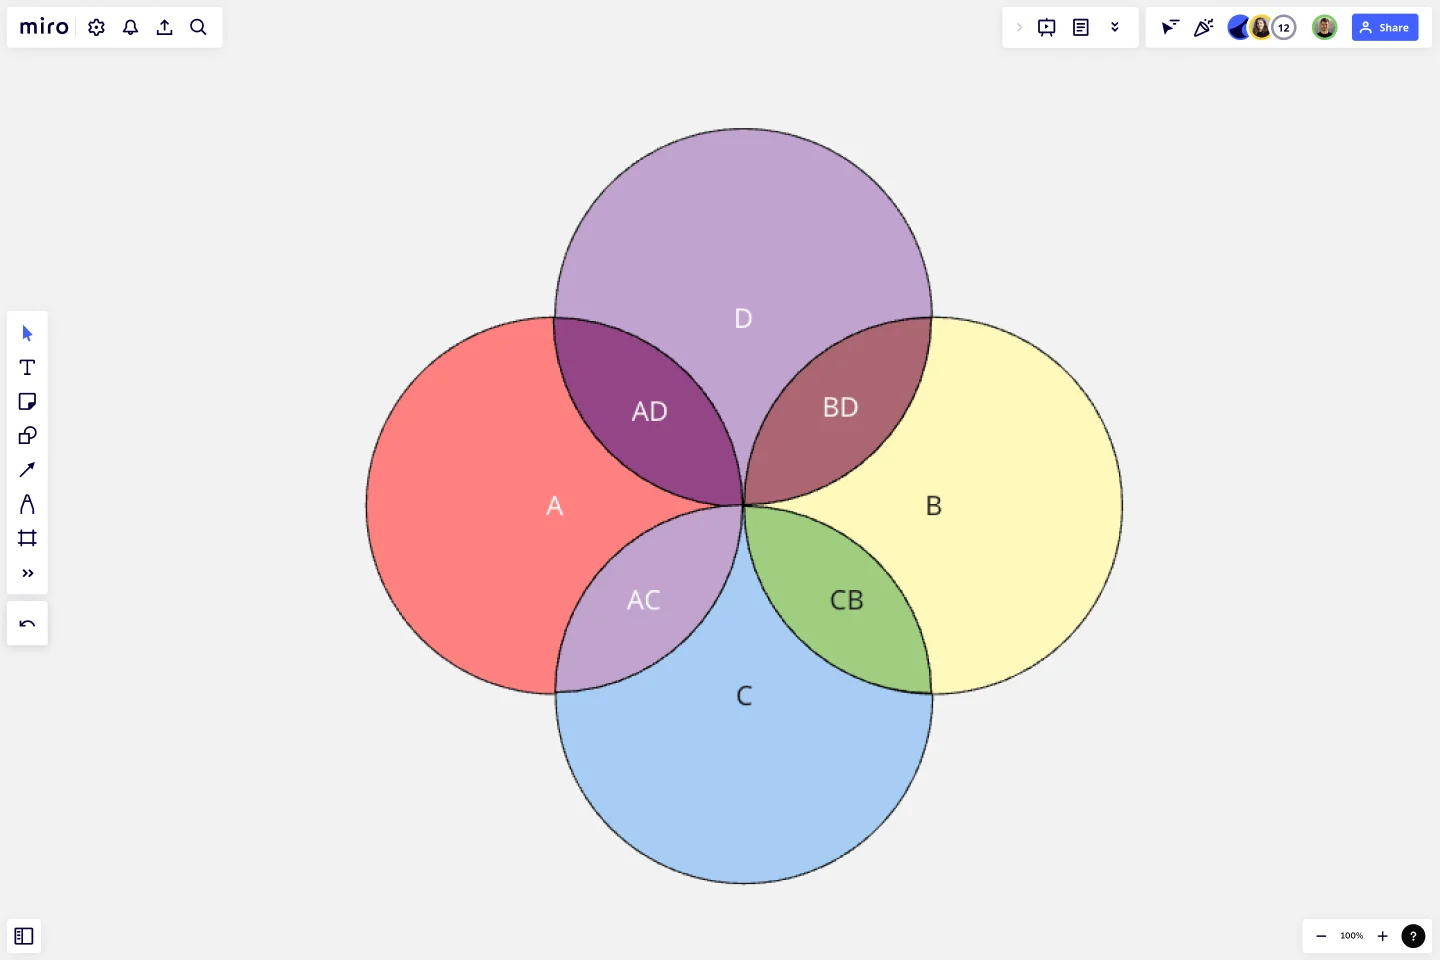
A 4-Circle Venn Diagram Template is a visual representation showcasing the relationships between four different data sets. Each circle in the diagram represents a unique set, and the areas where they intersect signify commonalities. This dynamic tool allows for easy comparison and contrast of information, making it a powerful aid in decision-making processes, problem-solving, data visualization, and more.
How to use a 4-Circle Venn Diagram Template in Miro
Step 1: Select the 4-Circle Venn Diagram Template. It will automatically load on your board.
Step 2: Customize your Venn diagram by clicking on each circle to edit the text. Input your specific sets of data into each circle.
Step 3: To show intersections and commonalities between your data sets, drag and adjust your circles so that they overlap in the necessary areas.
Step 4: Invite team members to collaborate by sharing the board with them. They can join in real-time to add comments, feedback, and ideas directly onto the Venn diagram.
Remember, with Miro, all changes are automatically saved, so you can return and change your diagram anytime. Enjoy creating a visual representation of your data that's both clear and engaging.
Miro is the perfect Venn diagram maker with a range of available templates and the ability to customize everything, from the number of circles to labeling and colors. Create professional Venn diagrams that will help you explain complex topics with confidence.
Can I customize the 4 Circle Venn Diagram Template in Miro?
Absolutely! Miro's templates are fully customizable. You can change your circles' colors, sizes, fonts, and arrangement. This allows for a truly tailored and personalized visualization experience.
Can multiple team members work on the Venn diagram simultaneously?
Yes, Miro's platform supports real-time collaboration. This means multiple team members can work on the Venn diagram simultaneously, making it perfect for brainstorming sessions or collaborative meetings.
Can I save and share my 4 Circle Venn Diagram?
Yes, you can easily save your work on your Miro board. To share it with others, simply use the share button to generate a link, or export your diagram as an image or PDF.
How can I use the 4 Circle Venn Diagram in a presentation?
Miro's 4 Circle Venn Diagram Template can easily be integrated into presentations. Use the frame tool to create a slide with your Venn Diagram, then present directly from Miro or export your frame as an image to insert into a presentation deck.
Get started with this template right now.
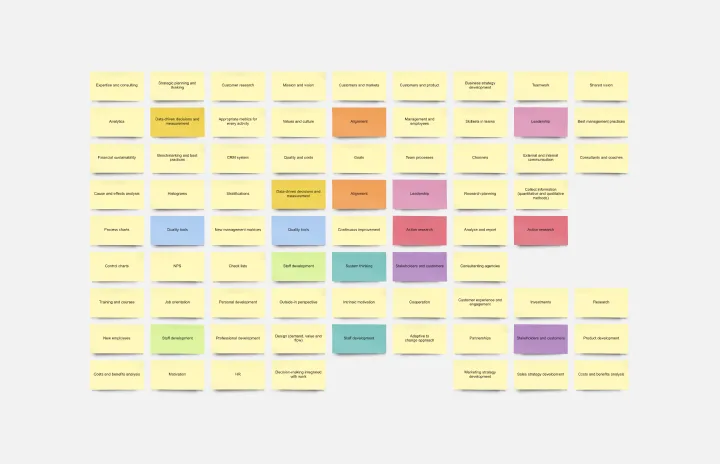
Lotus Diagram Template
Works best for:
UX Design, Ideation, Diagrams
Even creative thinkers occasionally need help getting their creative juices flowing. That's where a lotus diagram comes in. It'll empower you to run smoother, more effective brainstorming sessions. This creative-thinking technique explores ideas by putting the main idea at the diagram center and ancillary concepts in the surrounding boxes. This template gives you an easy way to create Lotus Diagrams for brainstorms, as well as an infinite canvas for the endless ideas generated.
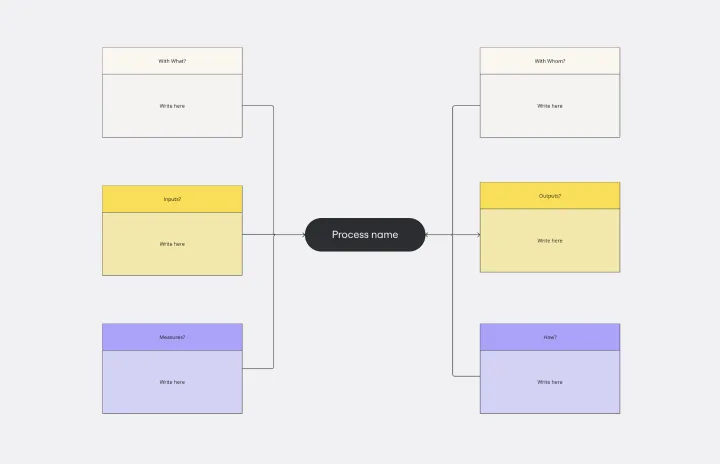
Turtle Diagram Template
Works best for:
Diagramming
The Turtle Diagram Template is an essential tool for capturing the essence of a process. It offers many benefits, but one stands out: it fosters clear and comprehensive communication within teams. By breaking down processes into digestible components, the template creates a common ground for discussion. It helps team members unfamiliar with certain processes or from different departments collaborate effectively by ensuring everyone's on the same page about the inputs, outputs, roles, resources, and procedures. This is crucial for organizations that aim to maintain coherence in quality management practices and drive collective efforts toward operational excellence.

Driver Diagram Template
Works best for:
Diagramming
The driver diagram template is a strategic visual tool that helps teams map out their primary objectives and break them down into actionable components. It presents goals, drivers, and specific change ideas in a coherent and interconnected format, ensuring clarity of objective. By doing so, every team member is aligned towards a common endpoint, fostering unified efforts. The visual nature of the template simplifies complex objectives, making it easier for teams to stay on track and measure their progress effectively.
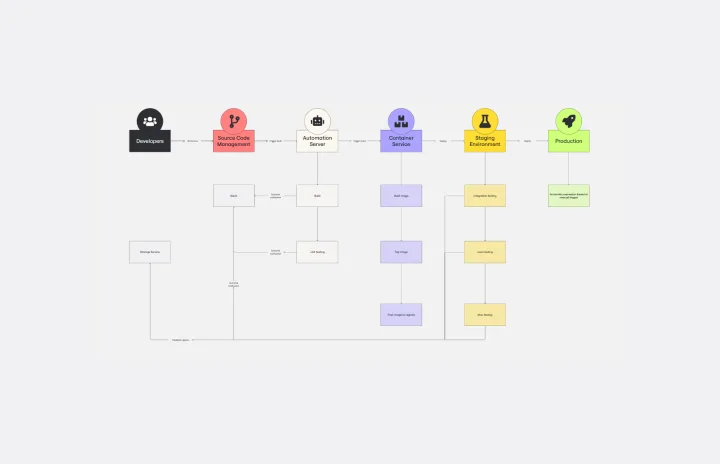
CI/CD Pipeline Diagram Template
Works best for:
Diagramming, Development
The CI/CD template is a well-designed roadmap for software deployment that enables a smooth and automated flow from development to production. This strategic layout includes critical elements such as source code management, automation servers, container orchestration, staging environments, and the final deployment to production. One of the key benefits of using such a template is that it builds a robust deployment pipeline, which significantly reduces manual intervention and human error. By visualizing each step and integrating automation throughout, teams can achieve faster deployment cycles, ensuring that new features, updates, and fixes are delivered to users promptly and reliably. This enhanced pace does not compromise quality, as the template inherently supports continuous testing and quality assurance, ensuring that each update is quick but also secure and stable before it is delivered to the end user.
Pie Chart Template
Works best for:
Education, Operations
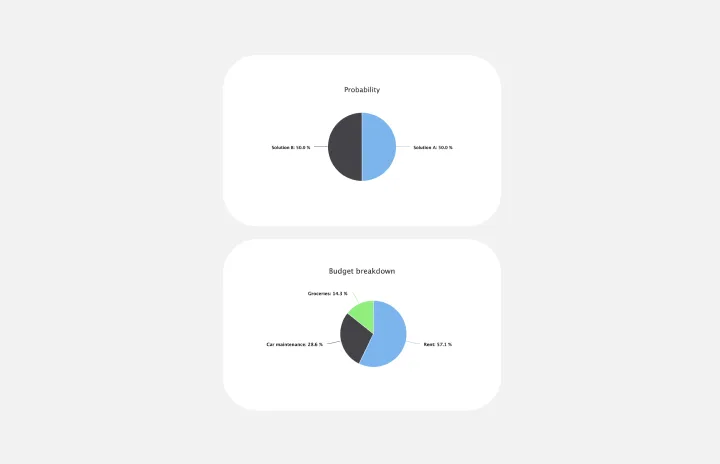
Pie charts are an excellent way to present relationships between datasets graphically, where you can quickly compare information and see contrast right away. Professionals from many fields use pie charts to support their presentations and enrich their storytelling as it’s one of the most commonly used data charts.
Driver Diagram Template
Works best for:
Diagramming
The driver diagram template is a strategic visual tool that helps teams map out their primary objectives and break them down into actionable components. It presents goals, drivers, and specific change ideas in a coherent and interconnected format, ensuring clarity of objective. By doing so, every team member is aligned towards a common endpoint, fostering unified efforts. The visual nature of the template simplifies complex objectives, making it easier for teams to stay on track and measure their progress effectively.