Onion Diagram Template
Discover the power and precision of the Onion Diagram Template. Visualize the components of a specific concept, system, or process and clarify their hierarchy and importance.
Trusted by 65M+ users and leading companies


About the Onion Diagram Template
At Miro, we always look for innovative ways to visually represent complex ideas, making collaboration more intuitive and productive. Our Onion Diagram Template is yet another tool in our suite designed to help you streamline your processes and achieve clarity in your projects.
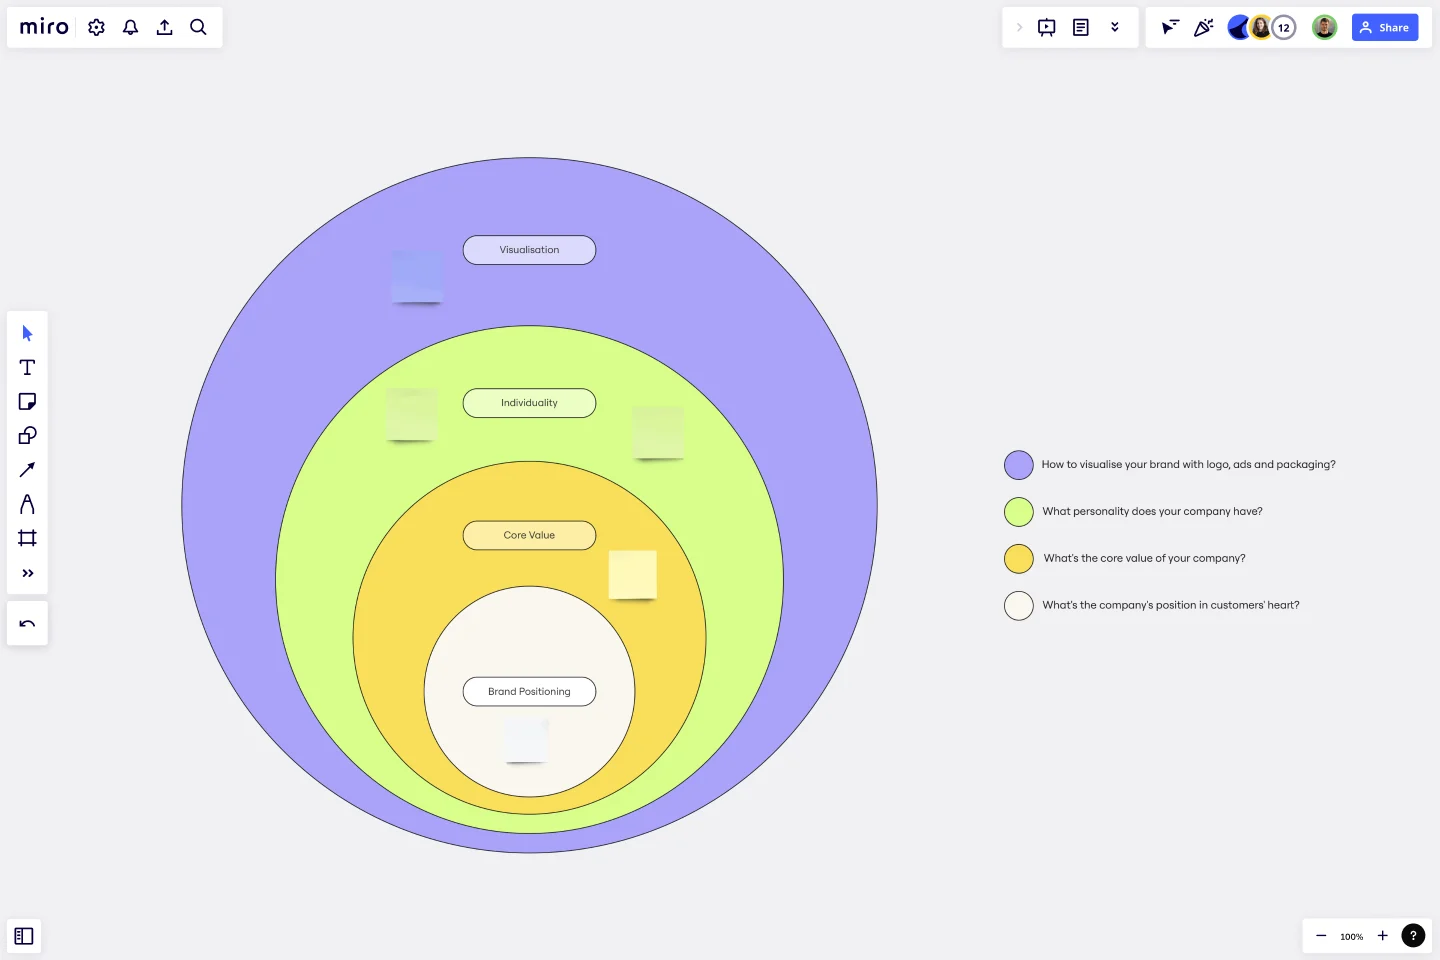
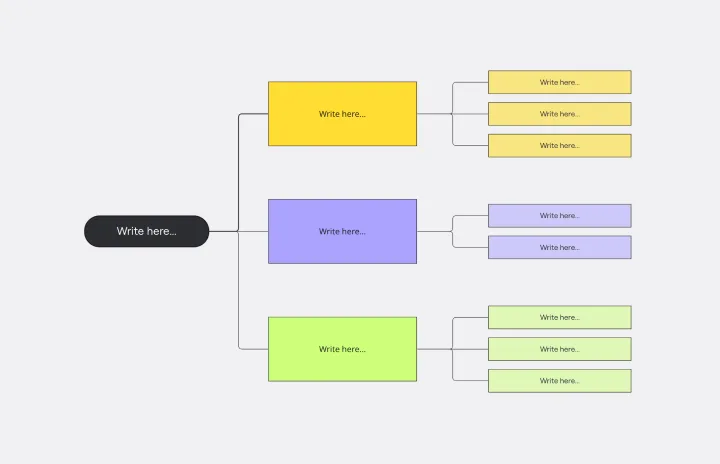
What's an Onion Diagram Template?
An onion diagram is a type of diagram that showcases layers of a concept, system, or process, much like the layers of an actual onion. Each layer of the diagram represents a different aspect or phase, starting from the innermost core and moving outwards to the outer layers. This structure allows viewers to understand relationships, hierarchies, or sequences in a visual, layered format.
What are the benefits of using an Onion Diagram Template?
Hierarchical visualization: Clearly see the priority or sequence of different elements in a process or system.
Easy analysis: Quickly identify bottlenecks, dependencies, or relationships between layers.
Universal usage: Suitable for various industries, including IT, business analysis, and education.
Enhanced collaboration: Team members can collectively analyze and change diagrams in real time.
How to use an Onion Diagram Template in Miro?
Using the Onion Diagram Template in Miro is straightforward:
Select the template: Go to Miro's Template Library and select the Onion Diagram Template.
Explore automated diagramming: Miro has automated diagramming features. Use our ready-made template and edit data as you see fit, or create an onion diagram from scratch using our shapes library. As you create your diagram, it can auto-adjust, making it easier to visualize complex layers.
Customize your diagram: Drag and drop elements, change colors, or add sticky notes to suit your specific needs.
Save and share: Once your onion diagram is complete, share the board link with team members for collaborative viewing and editing.
How many layers can I add to my onion diagram?
There's no strict limit to the number of layers. However, for clarity and usability, it's best to limit the layers to a number that's easily digestible for viewers.
Can I use the Onion Diagram Template on mobile devices?
Yes, Miro's platform is optimized for both desktop and mobile use, ensuring seamless collaboration regardless of the device.
Are there preset color schemes available for the onion diagram?
Yes, Miro provides a range of color palettes. You can also customize colors to align with your branding or preference.
Get started with this template right now.
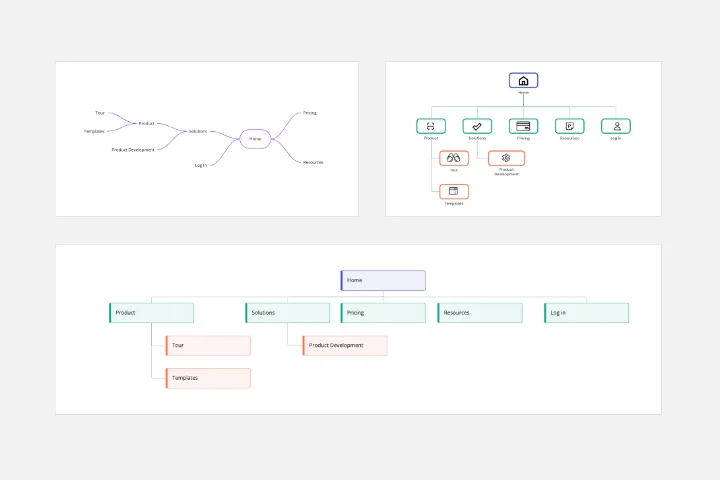
Sitemap Template
Works best for:
Mapping, Software Development, Diagrams
Building a website is a complex task. Numerous stakeholders come together to create pages, write content, design elements, and build a website architecture that serves a target audience. A sitemap is an effective tool for simplifying the website design process. It allows you to take stock of the content and design elements you plan to include on your site. By visualizing your site, you can structure and build each component in a way that makes sense for your audience.
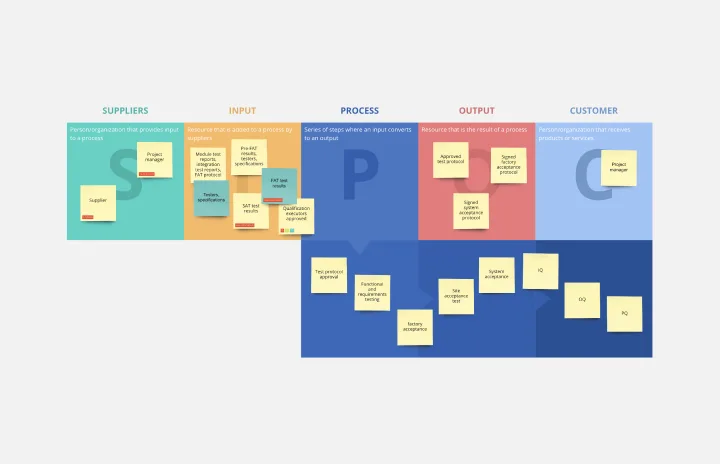
SIPOC Template
Works best for:
Agile Methodology, Strategic Planning, Mapping
A SIPOC diagram maps a process at a high level by identifying the potential gaps between suppliers and input specifications and between customers and output specifications. SIPOC identifies feedback and feed-forward loops between customers, suppliers, and the processes and jump-starts the team to think in terms of cause and effect.
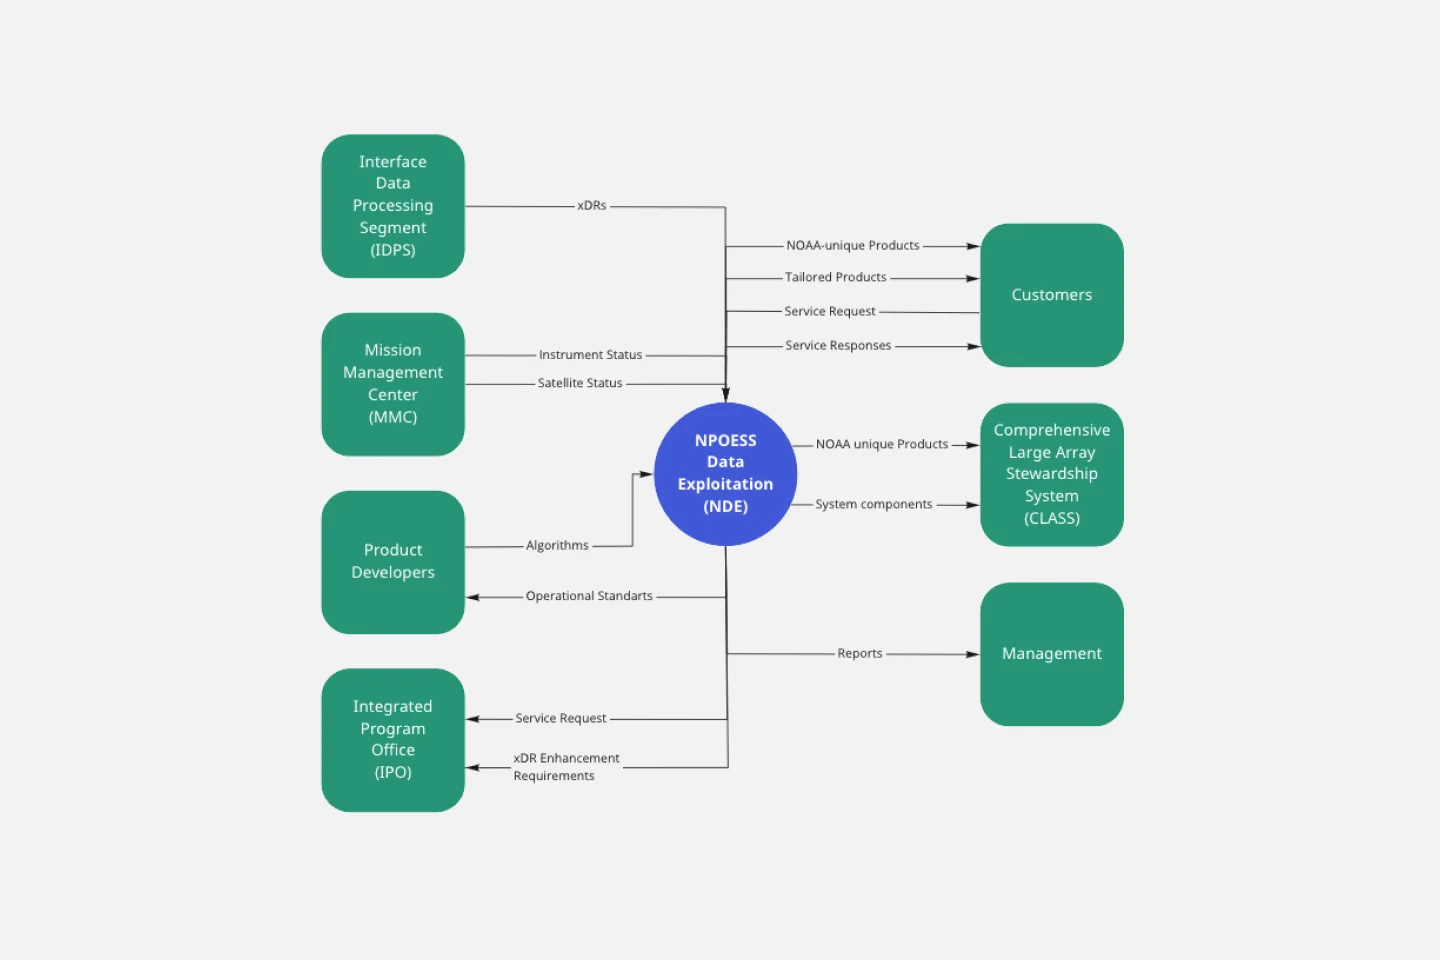
Context Diagram Template
Works best for:
Business Management, Mapping, Diagrams
A context diagram is a perfect tool to view an entire system as a single process and understand how external factors interact with it. These external factors can include customers, developers, management, and more. The Context Diagram Template is your tool for creating this diagram.

Login Sequence Diagram Template
Works best for:
Diagramming, Technical Diagramming
The UML Sequence Login Diagram Template is a valuable tool for visualizing user authentication processes. It breaks down complex login sequences into clear, visual components, facilitating collaborative understanding among team members, regardless of their technical expertise. This shared understanding is crucial for ensuring all stakeholders, from developers to project managers, are on the same page, leading to efficient decision-making and a smoother development process. The template's ability to translate technical details into an accessible format streamlines communication and significantly reduces the likelihood of misinterpretation or oversight, making it an essential asset in any software development project.
Brace Map Template
Works best for:
Diagramming, Planning
Transform your brainstorming and planning tasks with Miro's Brace Map Template. This powerful visual thinking tool clarifies complex concepts by creating a visual hierarchy that organizes each element precisely. The central idea connects seamlessly to sub-elements through intuitive braces, providing an easily understandable framework. This clarity enhances individual understanding and fosters collaborative efforts, allowing teams to navigate complex ideas with precision and coherence. The Brace Map Template will enable you to organize your thoughts efficiently and solve complexities visually.
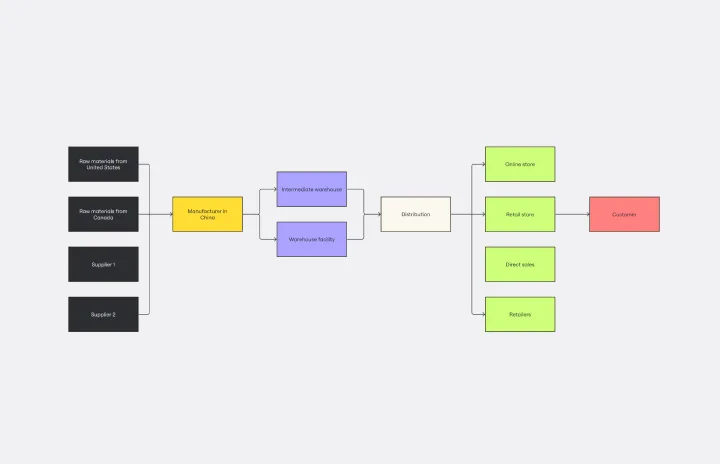
Supply Chain Diagram Template
Works best for:
Diagramming
The Supply Chain Diagram Template is great for businesses to streamline and enhance their supply chain processes. This template lets you visualize the entire supply chain, from sourcing raw materials to delivering finished products. Its intuitive layout simplifies complex networks, making identifying key areas and potential bottlenecks easier. One of the standout benefits of using this template is its clarity. It bridges the gap between complex processes and strategic decision-making by presenting a clear, visual supply chain representation. This clarity enables teams to pinpoint inefficiencies and implement more effective management strategies, which optimizes operations and facilitates better communication and understanding across different departments within an organization.