Cluster Diagram Template
Organize complex ideas and bring clarity to teams with the cluster diagram template.
Trusted by 65M+ users and leading companies


About the Cluster Diagram Template
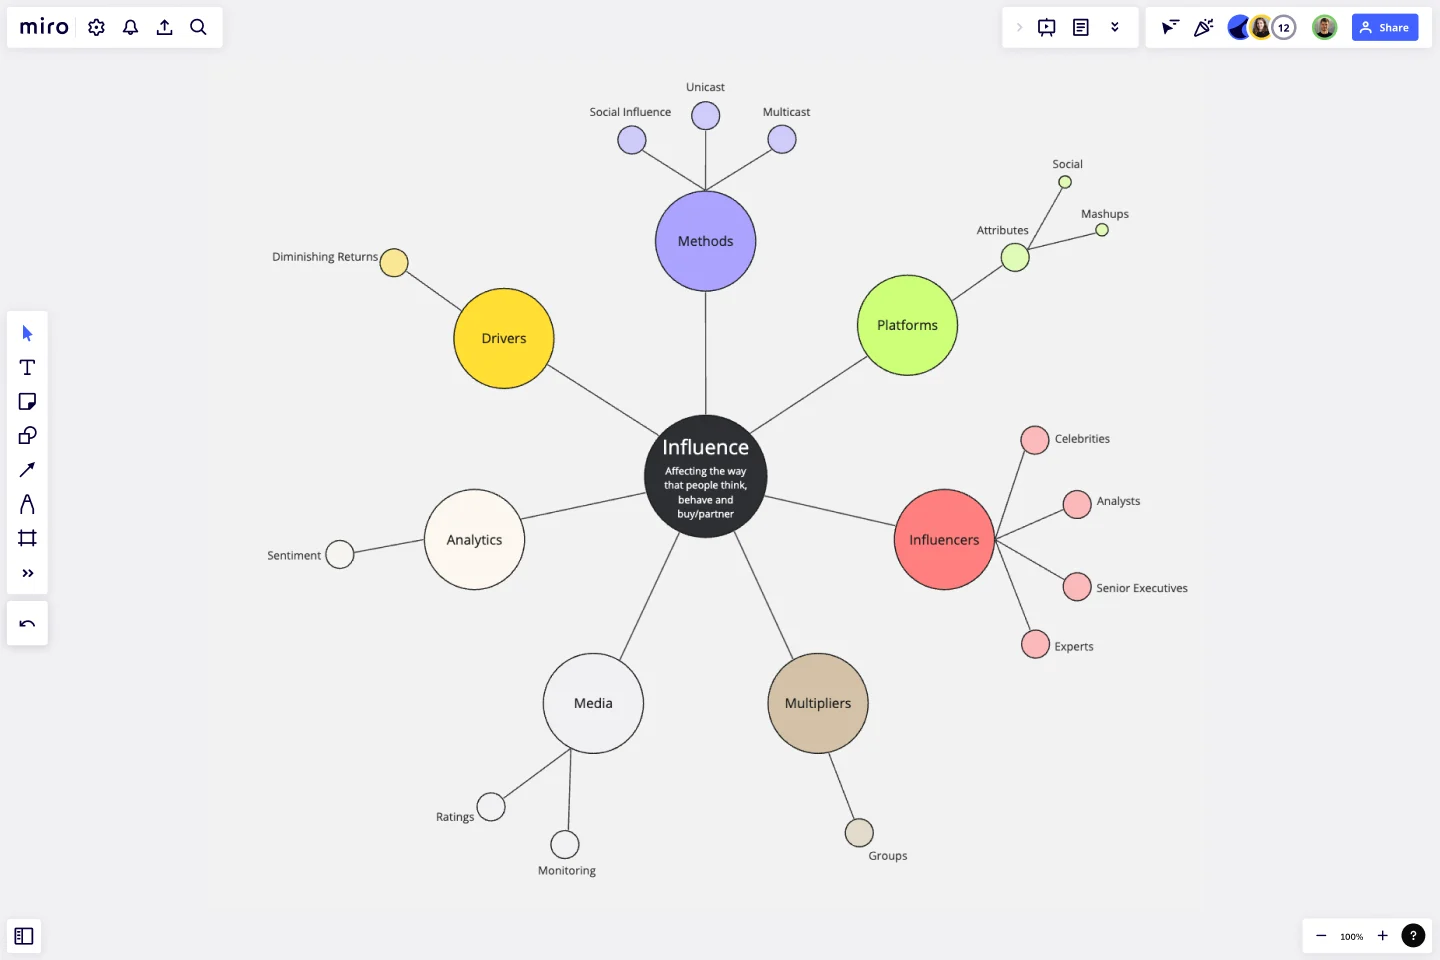
Unlock the potential of organized ideas with the cluster diagram template - a tool that brings structure to thoughts and processes. Essentially, this template is a method for visually grouping and comprehending complex ideas, information, or data sets. With its intuitive layout and adaptable features, it encourages collaborative analysis and categorization, revolutionizing the way concepts are connected and perceived.
The cluster diagram consists of several key areas that work together to create a visual information ecosystem. It has central nodes representing main ideas, surrounding clusters categorizing related concepts, and connector lines that map their relationships. This template helps to understand the relationships and hierarchies within a subject by placing core ideas at the center and branching them out into detailed subtopics. By using this template, you can create a map that is as informative as it is visually engaging.
How to use the cluster diagram template in Miro
Creating a detailed and dynamic cluster diagram is a seamless experience:
Start with the central node: Identify the main concept or idea and place it at the center of your board.
Add clusters: Branch out from the central node with clusters representing subtopics or related ideas.
Connect with lines: Draw connector lines between the central node and clusters and among clusters to illustrate the relationships.
Customize effortlessly: Edit the template with just a few clicks, changing colors, texts, and more to suit the specific needs.
Expand with ease: Use the automated diagramming features to add more branches and connector lines, growing the diagram organically.
Enrich the context: Drag and drop any artifact – images, documents, links – onto the board, integrating them into the diagram for enhanced depth and clarity.
This highly editable template invites users to iterate rapidly, expanding the clusters and refining ideas without sacrificing clarity or visual appeal.
Why should you use a cluster diagram template?
Using a cluster diagram template offers several compelling advantages:
Enhanced organization: It categorizes information into clear, visually distinct groups.
Improved understanding: The template simplifies complex systems, making them easier to grasp and communicate.
Increased engagement: Visual clustering captures attention and encourages interactive participation.
Flexible adaptation: It's adaptable enough to suit various contexts, from business strategies to education.
Facilitates idea generation: It provides a structured framework that can spark creativity and innovation.
Is it possible to work on the cluster diagram template collaboratively?
Yes, the template is perfect for collaboration, allowing multiple users to contribute simultaneously, share insights, and build upon each other's ideas in real time.
How does the cluster diagram template integrate with other analytical methods?
It's highly complementary and can be used alongside other analytical tools and methods to enhance data interpretation and idea generation.
Can the cluster diagram template be exported for presentations?
It can be effortlessly exported to various formats, making it an excellent tool for sharing insights and presenting organized information to stakeholders or team members.
Get started with this template right now.

2-Circle Venn Diagram Template
The 2 Circle Venn Diagram Template is a dynamic, intuitive tool designed to represent the logical relationships between two data sets visually. For teams, this template proves valuable in enabling efficient collaboration, clear communication, and shared understanding.
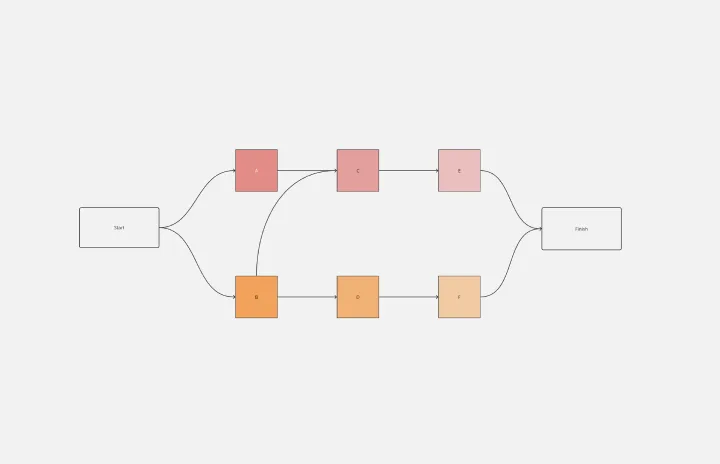
Precedence Diagram
Works best for:
Diagramming, Mapping
The Precedence Diagram Template offers a visual tool that maps out project activities and their interrelated sequences. This diagram empowers teams to recognize and anticipate workflow structures by illustrating the connections and dependencies among tasks.
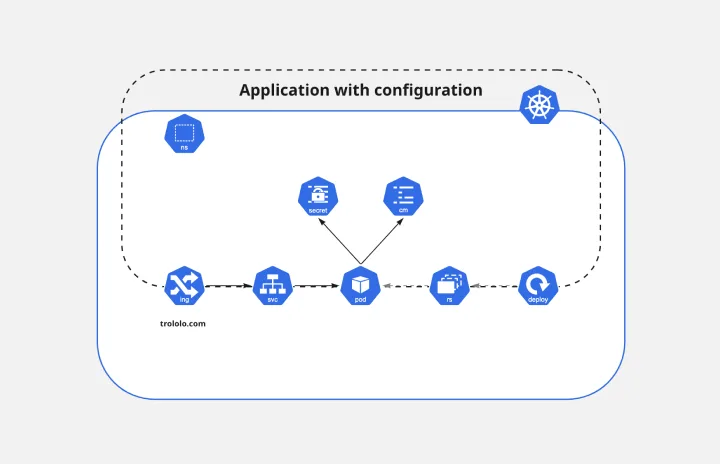
Kubernetes Application Template
Works best for:
Software Development, Diagrams
Use the Kubernetes Application template to manage enterprise-ready containerized applications better. You can now get your team more agile when dealing with portability, licensing, and consolidated billing. The Kubernetes Application template allows you to run deployments anywhere, facilitating the management of your applications. Try it out and see if it’s the best fit for you and your team.
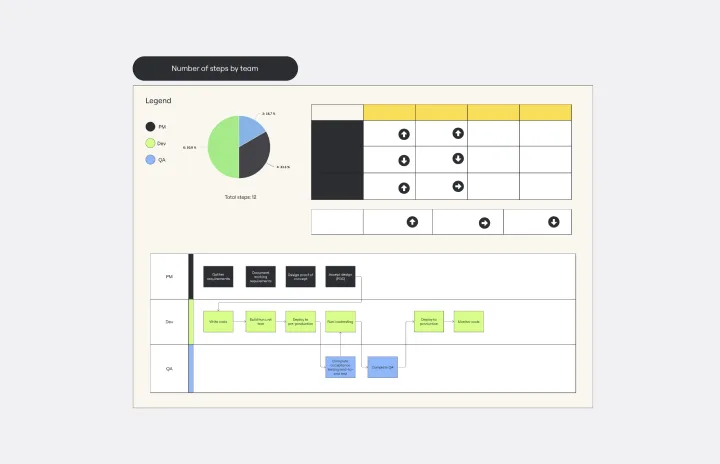
SDLC Template
Works best for:
Diagramming
The Software Development Life Cycle (SDLC) template is a well-designed visual tool that helps software development teams follow a structured approach from the initial concept to the final deployment of the software. One of the most significant benefits of using this template is that it promotes clear, streamlined communication among team members. By breaking the development cycle into distinct phases, all stakeholders can stay informed about the progress of the project and understand their responsibilities within the larger context. This enhanced communication reduces the chances of misunderstandings and ensures that everyone works together towards the common goal of delivering high-quality software. The template acts not only as a roadmap but also as a shared language for the team, improving collaboration and the efficient progression of the project through each critical stage.
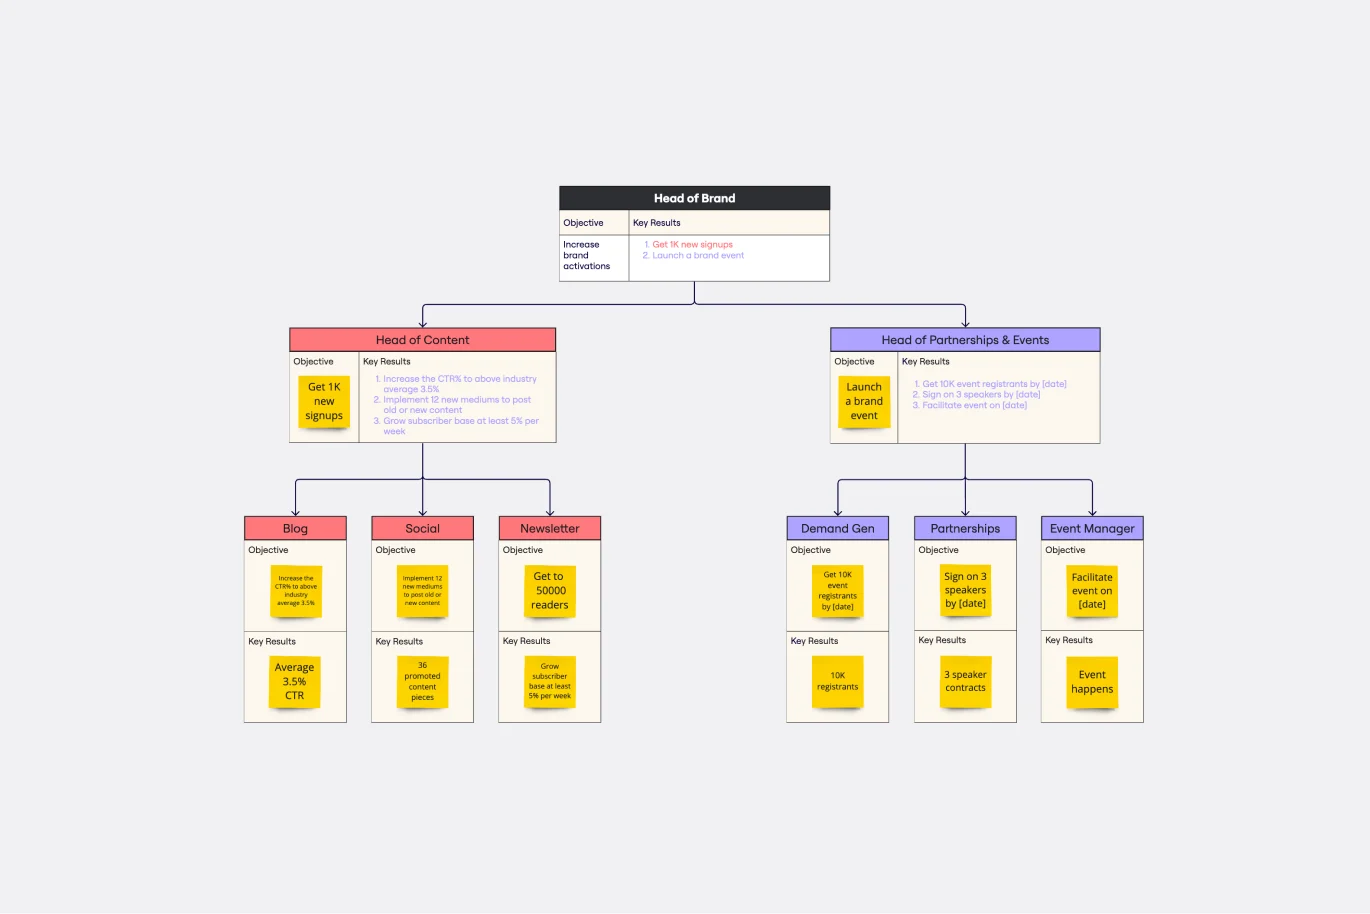
Objectives and Key Results (OKRs) Template
Works best for:
Leadership, Strategic Planning, Project Planning
Clarity, focus, and structure — those are the key ingredients to feeling confident in your company’s directions and decisions, and an OKR framework is designed to give them to you. Working on two main levels — strategic and operational — OKRs (short for objectives and key results) help an organization’s leaders determine the strategic objectives and define quarterly key results, which are then connected to initiatives. That’s how OKRs empower teams to focus on solving the most pressing organizational problems they face.
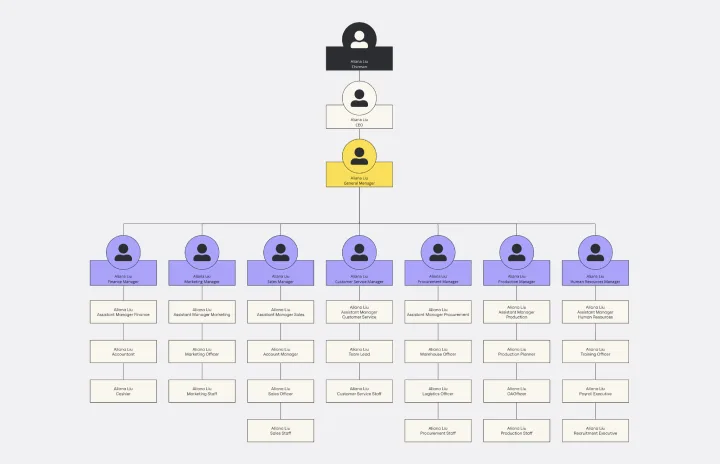
Vertical Organizational Chart
Works best for:
Diagramming, Organizational Charts, Organizational Design
The Vertical Organizational Chart Template is an efficient way to illustrate the hierarchy of an entity in a top-down format. This tool helps represent roles and relationships in a clear manner, starting from the topmost authority and branching downwards. It allows for a better understanding of the flow of responsibilities and communication channels within the organization. One of its most significant advantages is promoting clear communication. Depicting the organization's structure helps avoid misunderstandings and ensures everyone is on the same page regarding the chain of command.