Precedence Diagram
Optimize resource allocation with the Precedence Diagram Template. By discerning which tasks can run concurrently and which need to wait for others to complete, teams can manage their resources more effectively, ensuring smoother, more efficient project progression.
Trusted by 65M+ users and leading companies


About the Precedence Diagram Template
The Precedence Diagram Template is a powerful resource to help teams visualize their project workflows with clarity and precision. By enabling a clear representation of project management processes, the template fosters enhanced productivity and streamlines tasks, ensuring teams can navigate their projects with confidence and efficiency.
What is a Precedence Diagram?
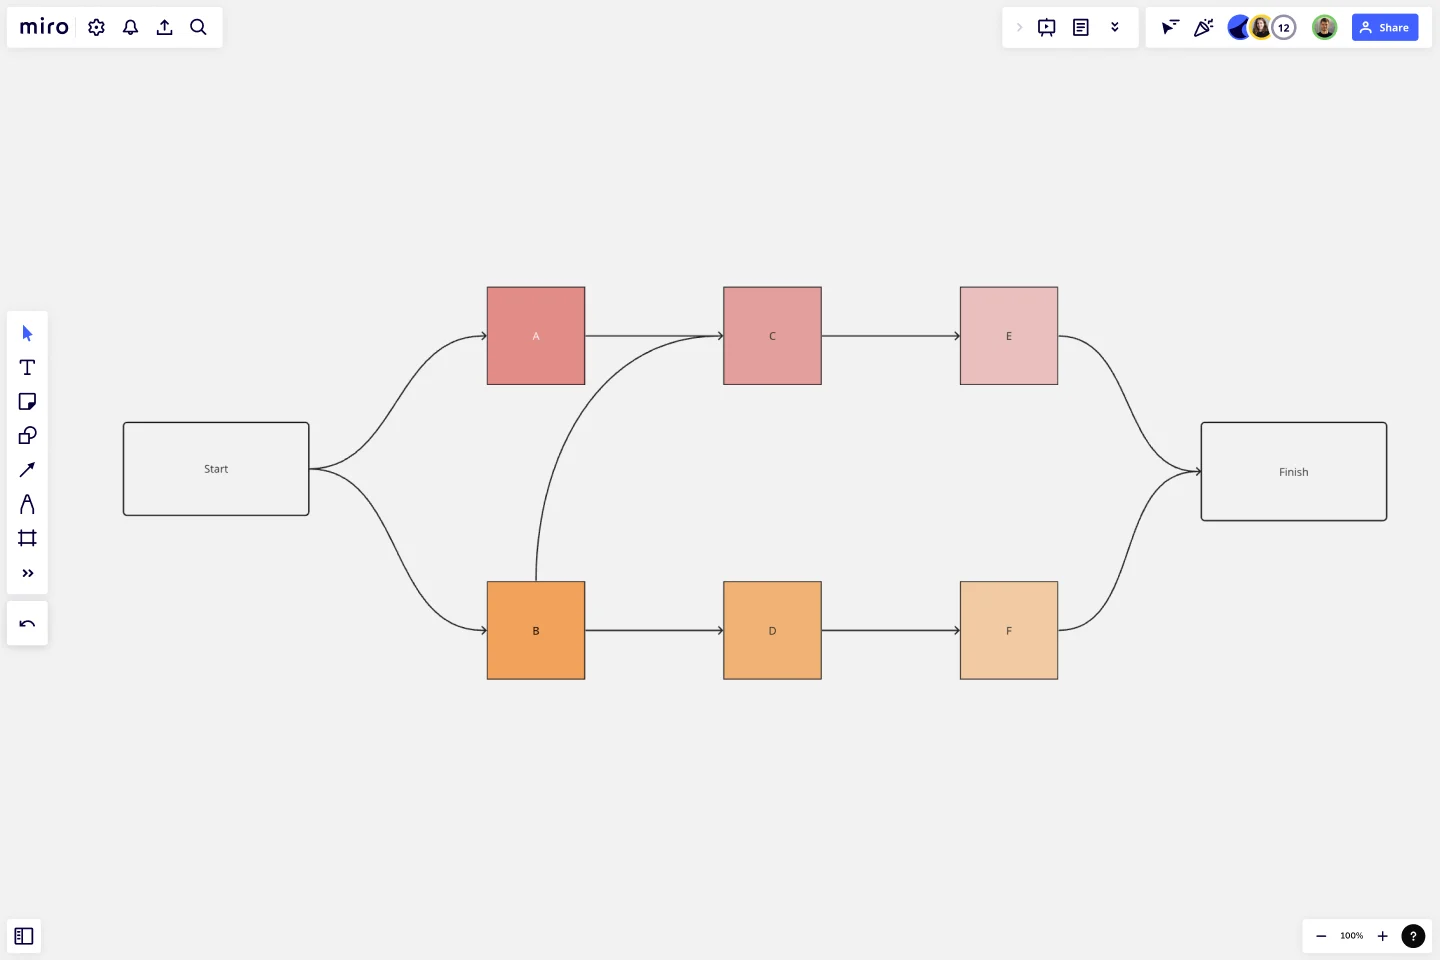
A precedence diagram, often called a Project Network Diagram, is a graphical tool that shows project activities and their interdependencies. By visualizing these connections, teams can gain clarity on the order in which tasks must be performed and identify which tasks can occur concurrently. The template is designed to simplify the creation of these valuable visualizations.
One significant benefit of using the Precedence Diagram Template is its ability to enhance project efficiency. By clearly outlining task sequences and potential overlaps, project managers can allocate resources more effectively and avoid bottlenecks, ensuring that the project remains on track and meets its deadlines. This foresight can save time and lead to substantial cost savings, making the precedence diagram an indispensable tool for any project-driven team.
How to use a Precedence Diagram Template in Miro
Miro's interactive board features, coupled with its automated diagramming capabilities, make creating precedence diagrams a breeze. Here's how you can set up a Precedence Diagram Template on your Miro board in four simple steps:
Select the Precedence Diagram Template: In the Template Library, search for "precedence diagram" and select the template from the results.
Customize your diagram: Use Miro's automated diagramming features to draw connections between tasks, indicating their relationships. Simply drag and drop items to reposition them or connect them with arrows to show the flow of tasks.
Collaborate and share: Invite your team members to collaborate in real time. Miro enables you to discuss, edit, and refine the diagram, ensuring everyone's on the same page.
Can I customize the look and feel of the precedence diagram?
Yes, Miro's interface is highly intuitive, allowing you to change colors, shapes, and fonts to match your team or project's branding.
Is there a limit to how many tasks I can add to my diagram?
There's no strict limit. However, for readability and usability, we recommend ensuring that your diagram remains clear and uncluttered by periodically reviewing and refining it.
Can I link other Miro boards or external resources to tasks in the precedence diagram?
Yes, you can! Simply use the linking tool in Miro to connect tasks to relevant boards or external resources, providing more context and information.
How do I ensure that only authorized team members can edit the diagram?
Miro allows you to set permissions for each individual or group. You can grant view-only, commenting, or editing access based on what's suitable for your team's needs.
Get started with this template right now.
Genogram Template
Works best for:
Diagramming
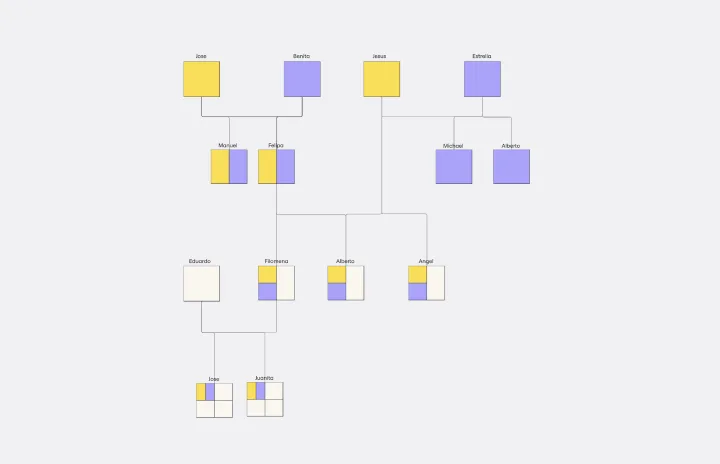
The Genogram Template maps out family structures and relationships with exceptional depth and detail. Unlike traditional family trees, this template provides a comprehensive perspective by encapsulating familial connections, emotional ties, and significant life events. Create a genogram to unearth patterns and trends within a family, whether hereditary or environmental. Professionals across different domains can gain a holistic understanding of familial dynamics by showing deep insights into the nuances of relationships, facilitating better communication and problem-solving.
SDLC Template
Works best for:
Diagramming
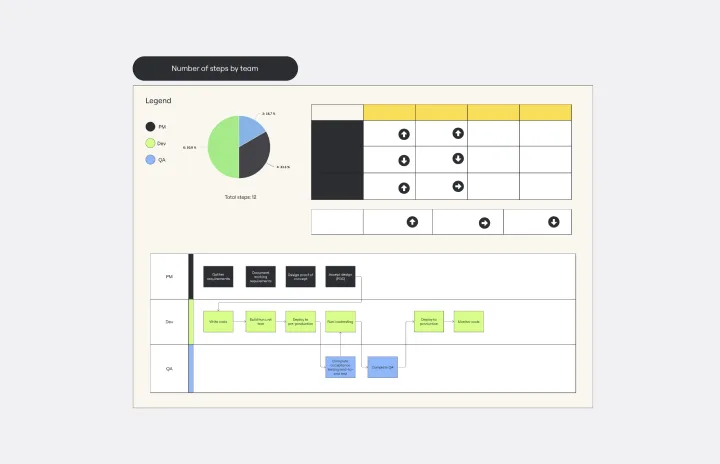
The Software Development Life Cycle (SDLC) template is a well-designed visual tool that helps software development teams follow a structured approach from the initial concept to the final deployment of the software. One of the most significant benefits of using this template is that it promotes clear, streamlined communication among team members. By breaking the development cycle into distinct phases, all stakeholders can stay informed about the progress of the project and understand their responsibilities within the larger context. This enhanced communication reduces the chances of misunderstandings and ensures that everyone works together towards the common goal of delivering high-quality software. The template acts not only as a roadmap but also as a shared language for the team, improving collaboration and the efficient progression of the project through each critical stage.

Force Field Analysis Template
Works best for:
Diagramming, Strategic Planning
A Force Field Analysis Template is a powerful tool that helps teams identify and analyze the forces supporting or hindering progress toward a specific change or goal. This template provides a visual space where you can brainstorm and plot out 'driving forces' that push objectives forward and 'restraining forces' that prevent advancement, all on a single, intuitive board. One of the primary benefits of utilizing the Force Field Analysis template is that it fosters a shared understanding among team members. By visually mapping out and discussing each force, teams can prioritize efforts, build consensus on the central issues to tackle, and collaboratively devise strategic plans to strengthen positive influences while reducing negative ones.

UML Communication Diagram Template
Works best for:
Software Development, Mapping, Diagrams
Most modern programs consist of many moving parts working to a precise set of instructions. With a communication diagram, you can visualize exactly how those parts work together, giving you a clearer understanding of your program as a whole. What’s more, the diagram leaves spaces for expanding the network of relationships as your product grows and evolves. A communication diagram is a vital tool in any software designer’s arsenal.
Objectives and Key Results (OKRs) Template
Works best for:
Leadership, Strategic Planning, Project Planning
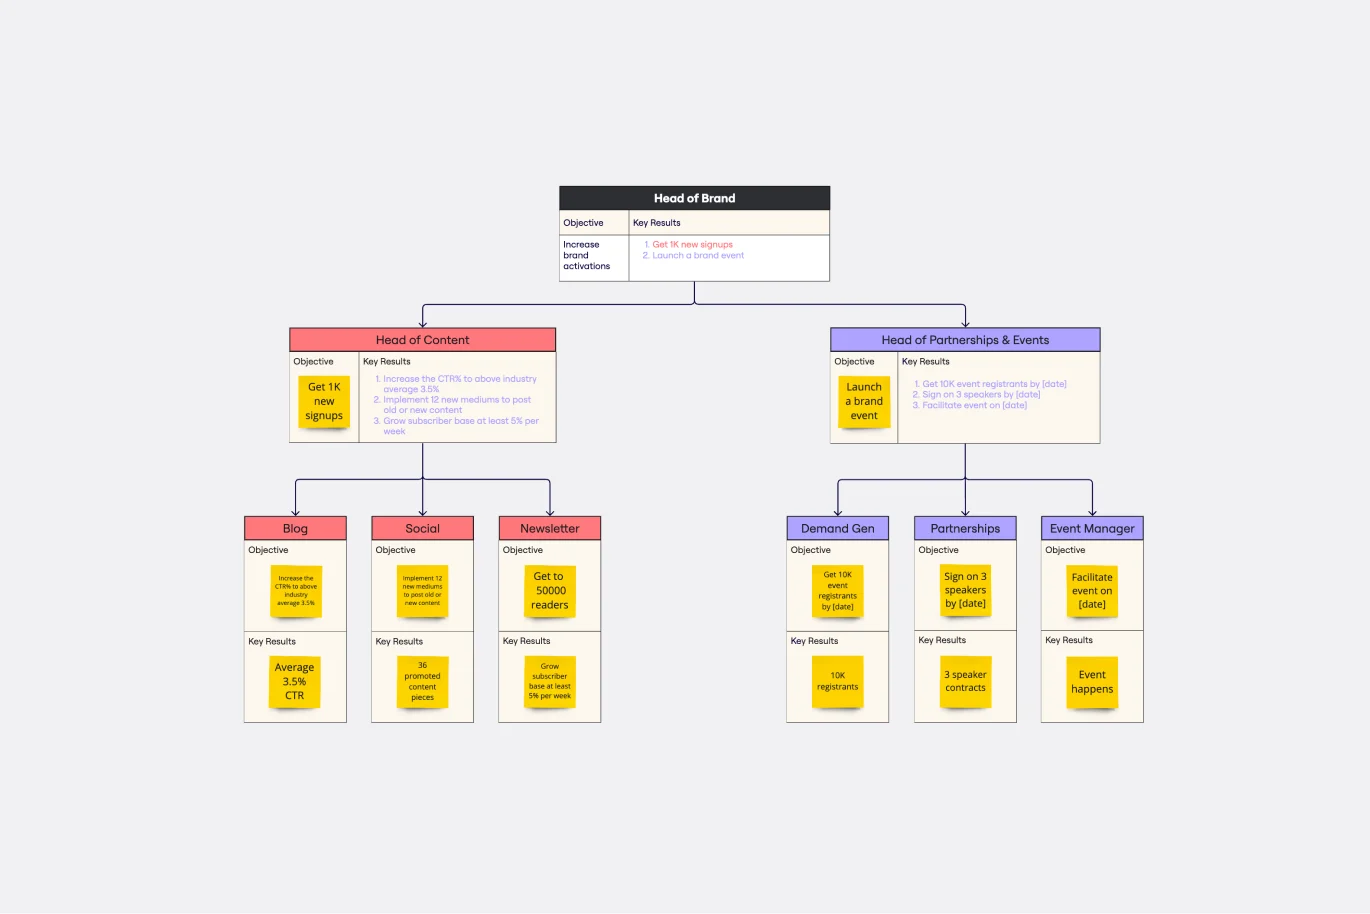
Clarity, focus, and structure — those are the key ingredients to feeling confident in your company’s directions and decisions, and an OKR framework is designed to give them to you. Working on two main levels — strategic and operational — OKRs (short for objectives and key results) help an organization’s leaders determine the strategic objectives and define quarterly key results, which are then connected to initiatives. That’s how OKRs empower teams to focus on solving the most pressing organizational problems they face.

Onion Diagram Template
Works best for:
Diagramming, Mapping and Diagramming
The Onion Diagram Template is a distinct tool designed to visually represent layers of a specific concept, system, or process, akin to the layers of an onion. Each concentric layer of the diagram provides insights into a different aspect or phase of the topic at hand, moving from the core foundational element outwards to more peripheral components. One of the prime benefits of this template is its ability to offer hierarchical clarity. Users can immediately discern the importance, sequence, or interrelation of different elements within a system, facilitating enhanced comprehension and efficient decision-making.