Cisco Network Diagram Template
Cisco offers data center and access networking solutions built for scale with industry-leading automation, programmability, and real-time visibility.
Trusted by 65M+ users and leading companies


About the Cisco Data Network Diagram Template
Cisco offers data center and access networking solutions built for scale with industry-leading automation, programmability, and real-time visibility. The Cisco Data Network Diagram template can help you design and showcase the organization’s network infrastructure.
Keep reading to learn more about the Cisco Data Network Diagram Template.
What is the Cisco Data Network Diagram Template
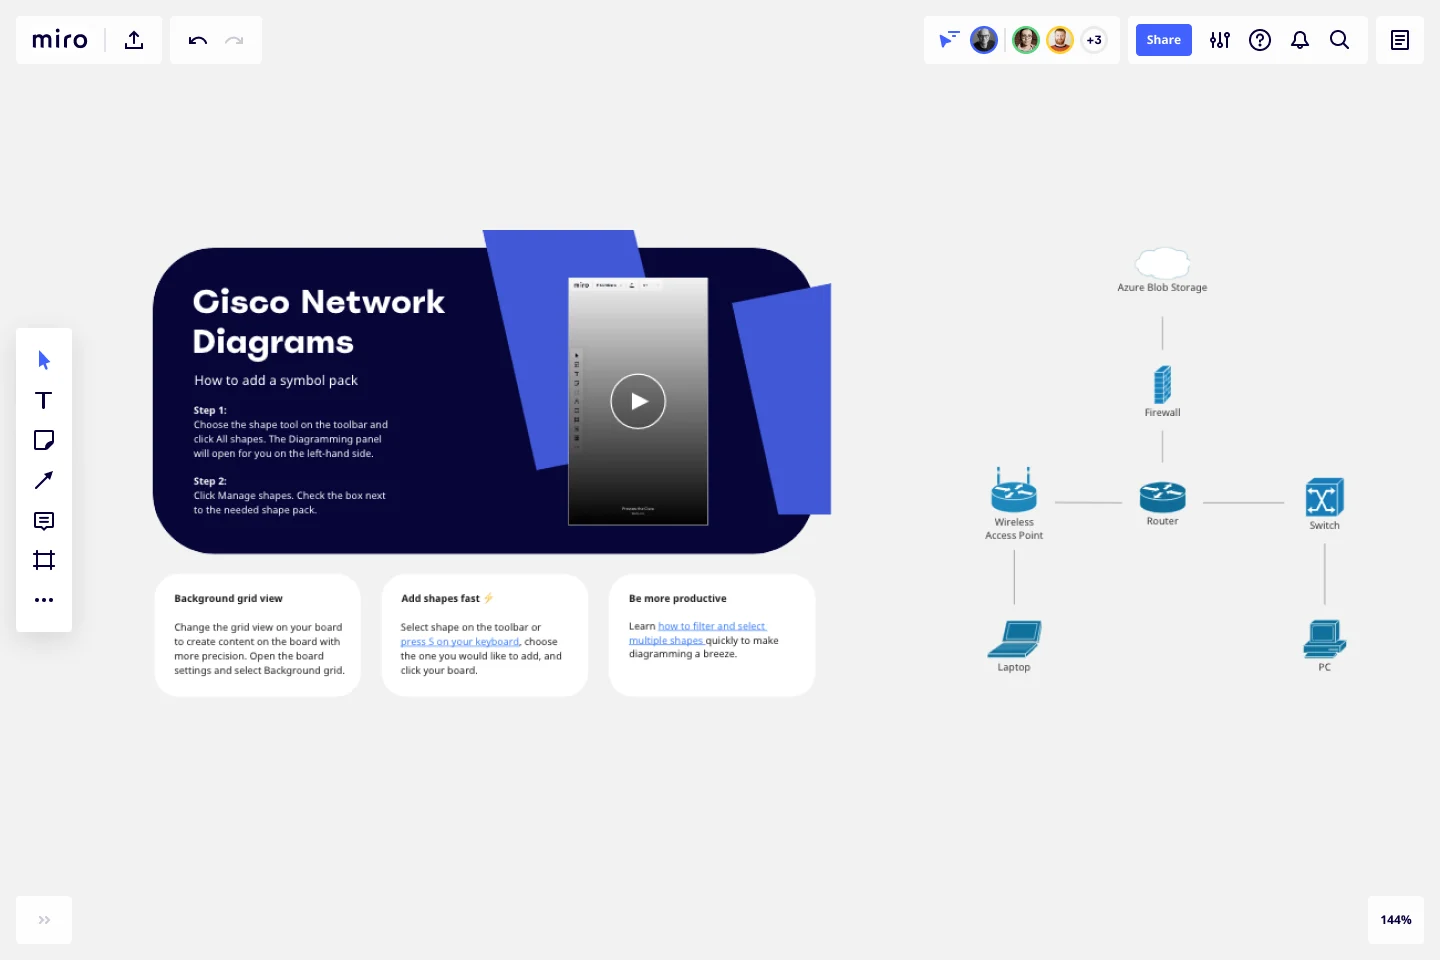
The Cisco Data Network Diagram Template, like any other network diagram, visually shows the design of the network infrastructure. The Cisco Data Network Diagram has unique icons and symbols.
When to use Cisco Data Network Diagram Template
You can use the Cisco Data Network Diagram Template to visualize the telecommunication and computer network topology and layout.
Here you can find the semantics of Cisco Data Network Diagrams:
Shapes: Icons represent a Cisco service or product.
Connectors: Use arrows to indicate flows (e.g. data, information, communication). Use a single-headed arrow to indicate a single initiator. Use a double-headed arrow to indicate that the icon shown at either end of the arrow can initiate a flow.
Layout and Grouping: Groups show the connection between multiple services/products and can represent layers of the architecture.
If you are interested in creating other network diagrams, Miro is the perfect network diagram tool with several available shape packs and templates to suit your needs.
How do I make a Cisco Data Network Diagram Template?
To make a Cisco Data Network Diagram in Miro is easy. You can use our Cisco Data Network Diagram Template and customize it as you see fit. Once you have the diagram structure, you can start adding the icons. You can find the icons under our Cisco Icon Set integration.
Get started with this template right now.
Project Organizational Chart Template
Works best for:
Project Management, Documentation, Org Charts
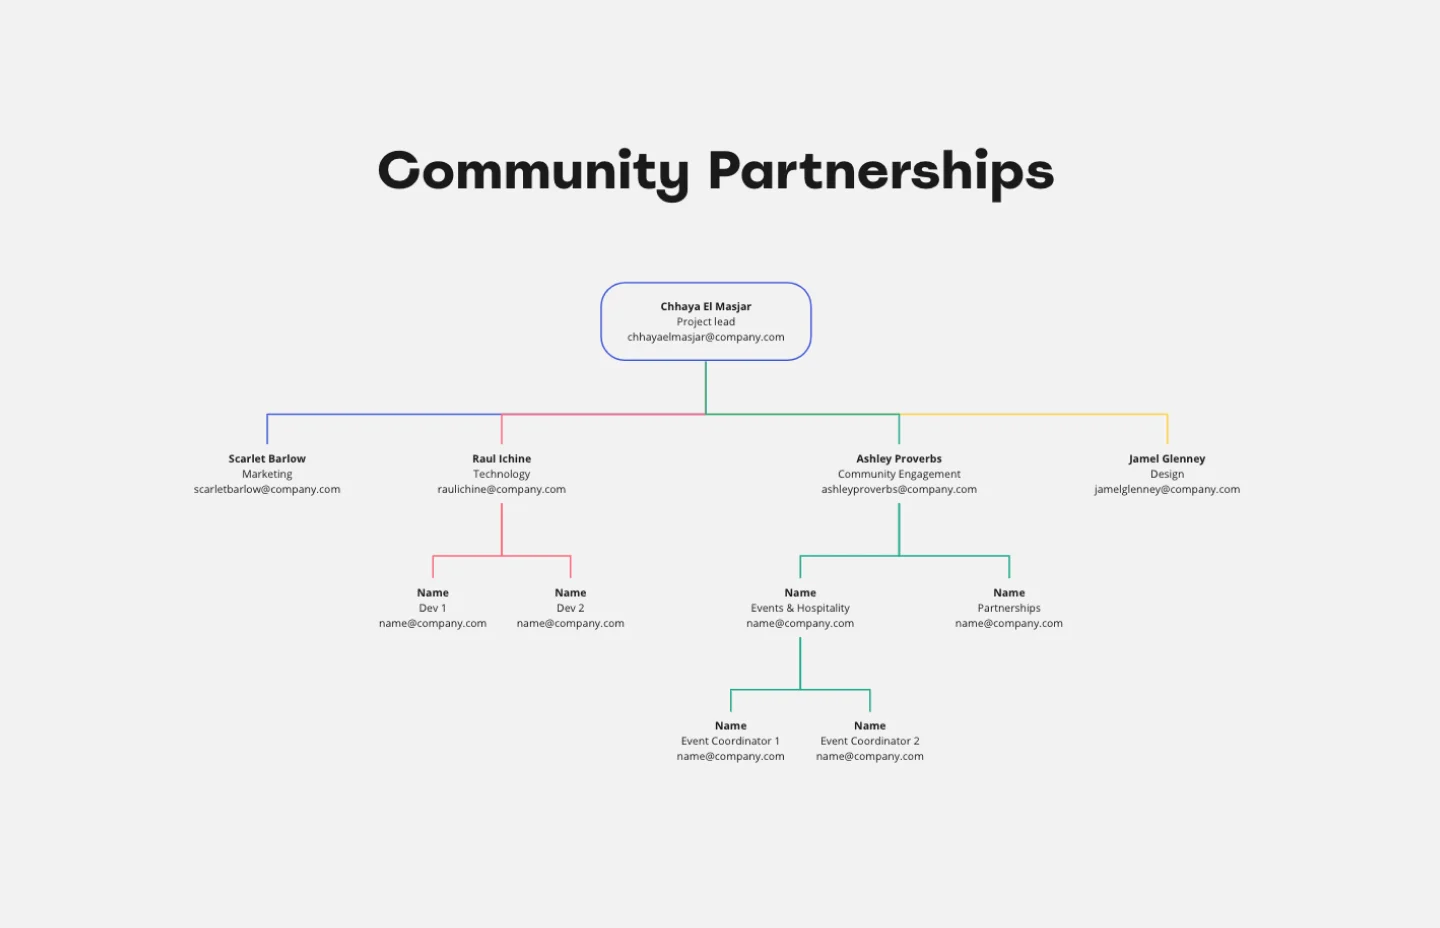
When you’re embarking on a long, complex project, you will inevitably hit roadblocks and obstacles. It’s important to have your project organizational chart on hand to overcome those challenges. A project organizational chart is a visual diagram that illustrates who is on your team and the role they play in a given project. It documents the structure of the project organization, the hierarchy between team members, and the relationships between employees. Project organizational charts are useful tools for clarifying who does what, securing buy-in, and setting expectations for the group.
Disney Creative Strategy Template
Works best for:
Business Management, Ideation, Brainstorming
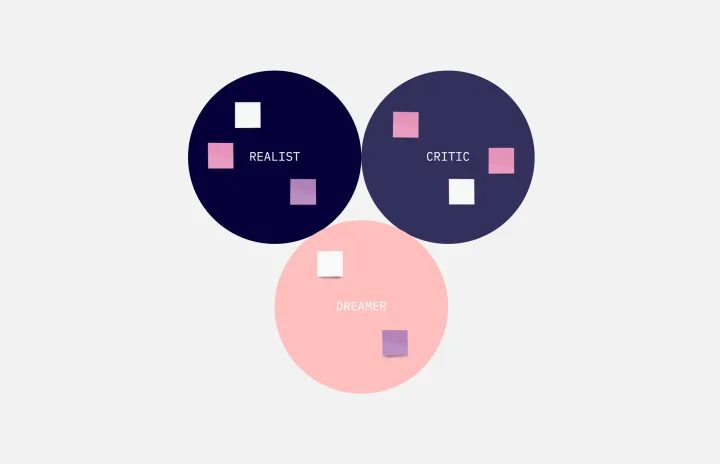
Know who knew a little something about coming up with ideas that set imaginations alight? Walt Disney. And he inspired the Disney Creative Strategy, an approach that establishes three types of thinkers—dreamers, realists, and critics—and gives each the space to do clear thinking. Your team will go through an engaging exercise of adopting the three mindsets, where they’ll focus on a specific aspect of the idea. The Disney Creative Strategy has a way of yielding brilliant ideas and great products. That’s why it’s used successfully by organizations of all kinds and sizes.
Current State vs. Future State Flowchart Template
Works best for:
Diagramming
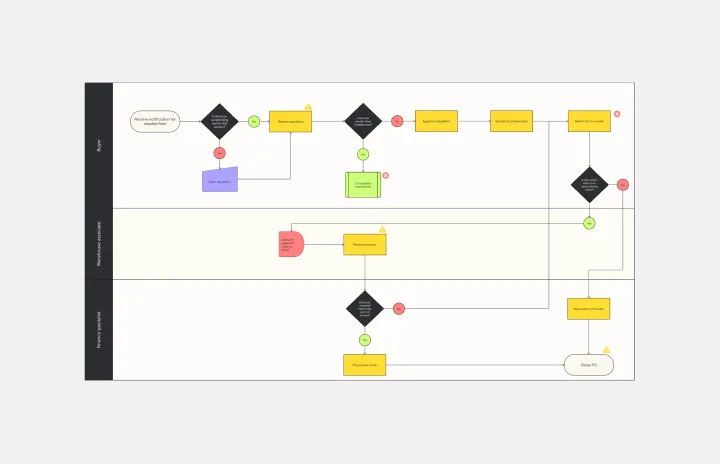
The Current State vs Future State Flowchart Template is an essential tool for strategic planning, providing teams with a dynamic and visual roadmap for organizational transformation. One of its key benefits is streamlining collaboration by using swimlanes to allocate tasks to specific departments. This feature promotes accountability and transparent communication, ensuring everyone is aligned on their responsibilities. As a result, teams can navigate complex processes with ease, fostering a shared understanding of the current and future states, ultimately leading to efficient and collaborative decision-making.
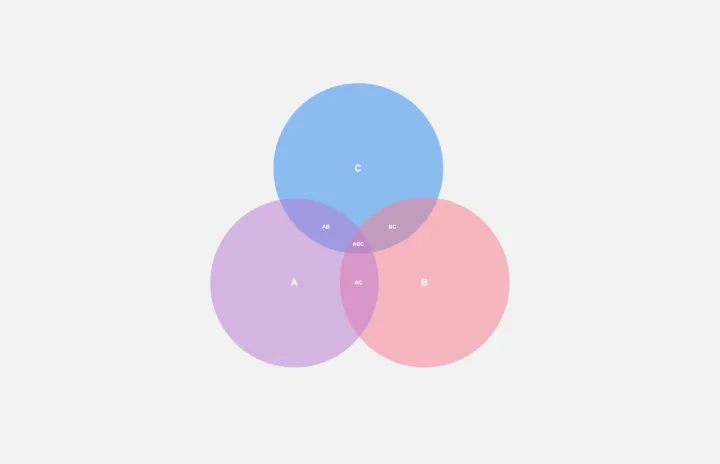
3-Circle Venn Diagram
Works best for:
Education, Diagrams, Brainstorming
Venn diagrams have been a staple of business meetings and presentations since the 1800s, and there’s a good reason why. Venn diagrams provide a clear, effective way to visually showcase relationships between datasets. They serve as a helpful visual aid in brainstorming sessions, meetings, and presentations. You start by drawing a circle containing one concept, and then draw an overlapping circle containing another concept. In the space where the circles overlap, you can make note of the concepts’ similarities. In the space where they do not, you can make note of their differences.
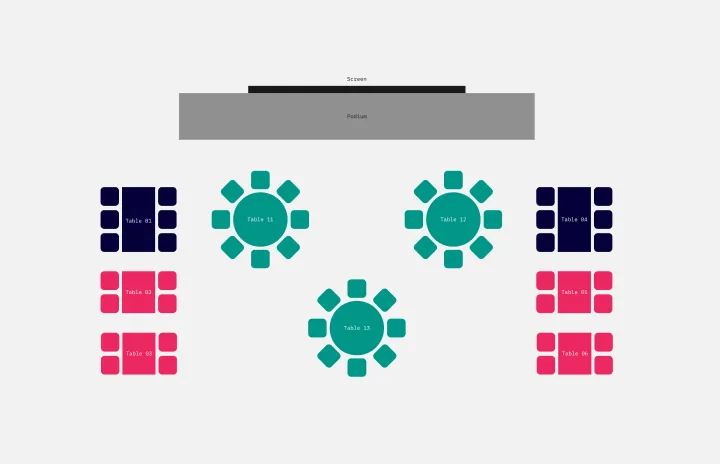
Floor Plan Template
Works best for:
Operations, Workshops
Maybe you’re planning a big occasion or event. Or maybe you’re arranging seating structures and traffic flows that are more permanent. Either way, creating a floor plan—an overhead scaled diagram of the space—is equal parts functional and fun. This template will let you visualize how people will move about the space and know quickly if the space will do what you need, before you commit time, money, or resources. And you’ll be able to get as detailed as you want—finding the right measurements and dimensions, and adding or removing appliances and furniture.
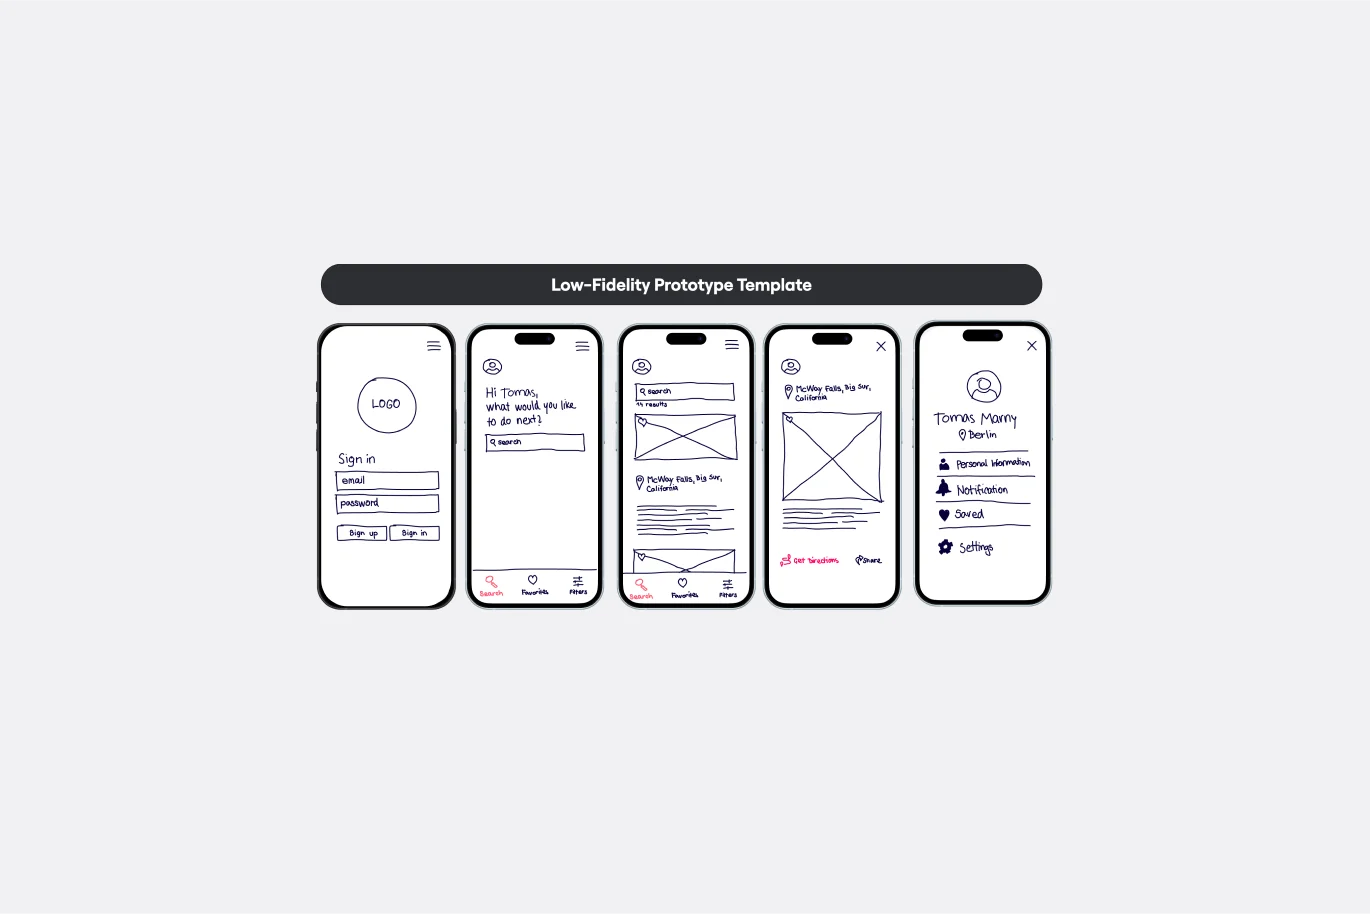
Low-Fidelity Prototype Template
Works best for:
Design, Desk Research, Wireframes
Low fidelity prototypes serve as practical early visions of your product or service. These simple prototypes share only a few features with the final product. They are best for testing broad concepts and validating ideas. Low fidelity prototypes help product and UX teams study product or service functionality by focusing on rapid iteration and user testing to inform future designs. The focus on sketching and mapping out content, menus, and user flow allows both designers and non-designers to participate in the design and ideation process. Instead of producing linked interactive screens, low fidelity prototypes focus on insights about user needs, designer vision, and alignment of stakeholder goals.