Current State vs. Future State Flowchart Template
Strategically allocate tasks, visualize process changes, and identify bottlenecks with the current state vs. future state flowchart template.
Trusted by 65M+ users and leading companies


About the Current State vs. Future State Flowchart Template
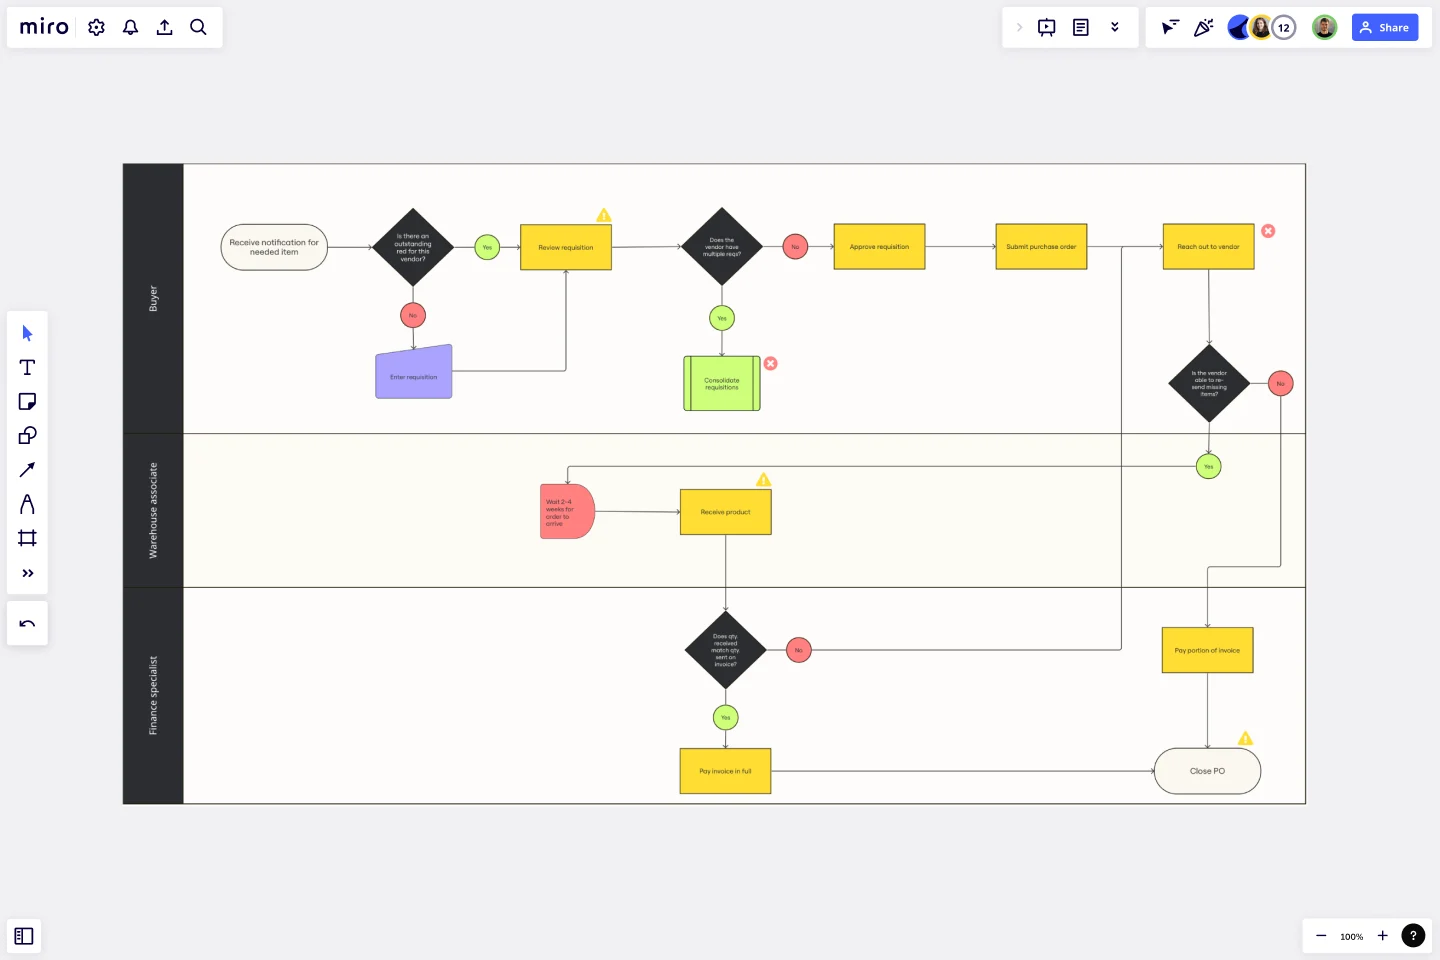
The Current State vs Future State Flowchart Template is essential for teams facing complex processes. This powerful asset provides clarity and structure to workflows, employing swimlanes to clarify departmental responsibilities and layers to offer a nuanced view of process changes. With its strategic guidance, teams can identify and address bottlenecks with precision, empowering them to navigate their transformational journey with confidence and ease. Don't let complex processes slow you down - use the Current State vs Future State Flowchart Template to take control.
Understanding the template
The Current State vs Future State Flowchart Template is designed to allocate tasks to respective departments using swimlanes, which helps to define roles and responsibilities clearly. The template also has layers that allow for dynamic representation of changes between the current and future states. This tool goes beyond just visualizing the process, as it can help teams identify bottlenecks and improve efficiency by streamlining workflows.
How to use the current state vs. future state flowchart template in Miro
Optimize task allocation with swimlanes: Use swimlanes to assign tasks to specific departments, fostering transparency in responsibilities and facilitating streamlined communication.
Enhance visualization with layers: Leverage layers to dynamically represent changes between current and future processes, offering a detailed and adaptable perspective on the transformation journey.
Proactively address bottlenecks: Analyze the flowchart to identify bottlenecks, providing teams with actionable insights to address challenges and optimize workflow efficiency proactively.
Why should you use a current state vs. future state flowchart template?
Precision with swimlanes: Clearly understand and communicate which department is responsible for each task, ensuring accountability and clarity within the team.
Nuanced process visualization: Employ layers to visualize complex changes between current and future processes, offering a comprehensive and adaptable representation of the transformational journey.
Identify bottlenecks: The template serves as a strategic tool, enabling teams to address challenges and optimize workflow efficiency strategically.
Transparent communication: Use swimlanes to precisely define responsibilities, promoting transparent communication and alignment on tasks and objectives.
Efficiency optimization: Pinpointing bottlenecks empowers teams to optimize workflows, enhancing overall efficiency and effectiveness.
If you'd prefer to start from scratch, flowcharting with Miro is easy! You can choose from a wide range of flowchart shapes in Miro's extensive library, so you'll find just what you need.
Can I export the flowchart for external use or presentations?
Miro provides export options, allowing you to save your flowchart as an image or PDF for external sharing or adding to presentations.
Are there any pre-built templates for specific industries or processes?
While the Current State vs Future State Flowchart Template provides a versatile framework, Miro also offers industry-specific templates that can be customized to meet your unique needs.
Get started with this template right now.
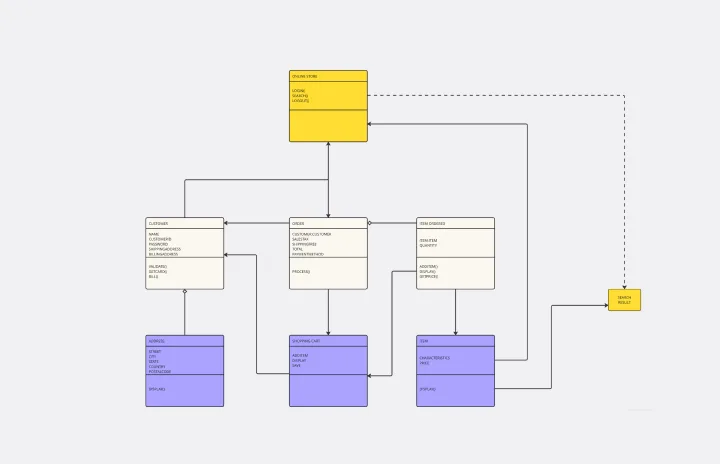
UML Class Diagram Template
Works best for:
UML Class Diagram Template, Mapping, Diagrams
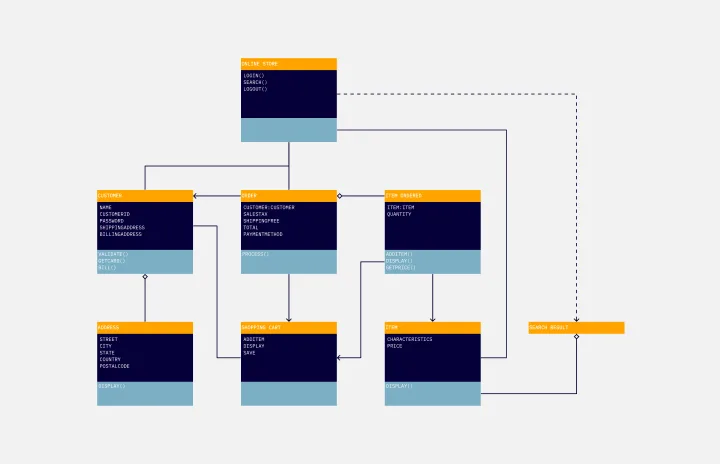
Get a template for quickly building UML class diagrams in a collaborative environment. Use the UML class diagram template to design and refine conceptual systems, then let the same diagram guide your engineers as they write the code.
Dichotomous Key Template
Works best for:
Diagramming
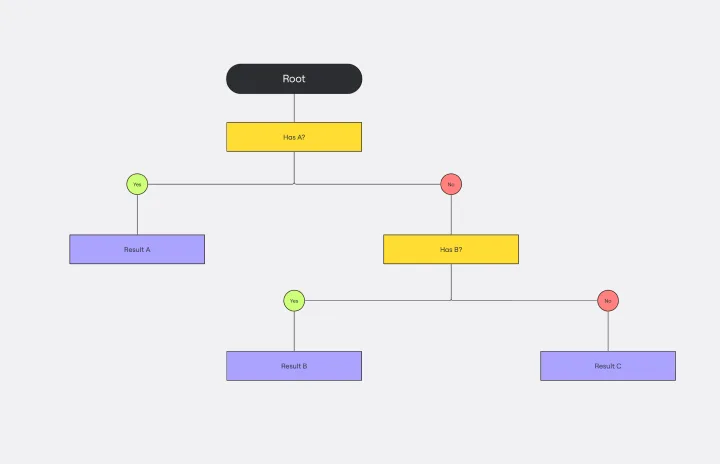
The Dichotomous Key Template stands out as an exceptional tool for simplifying complex classification processes, significantly enhancing learning experiences. Breaking down intricate subjects into a series of binary decisions transforms how information is absorbed and understood. This systematic approach not only aids in retaining intricate details but also makes the learning process more engaging and interactive. Whether for educational purposes or professional use, the template’s design fosters a deeper comprehension of the subject matter, allowing learners and professionals to navigate complex scenarios with clarity and ease.
Project Organizational Chart Template
Works best for:
Project Management, Documentation, Org Charts
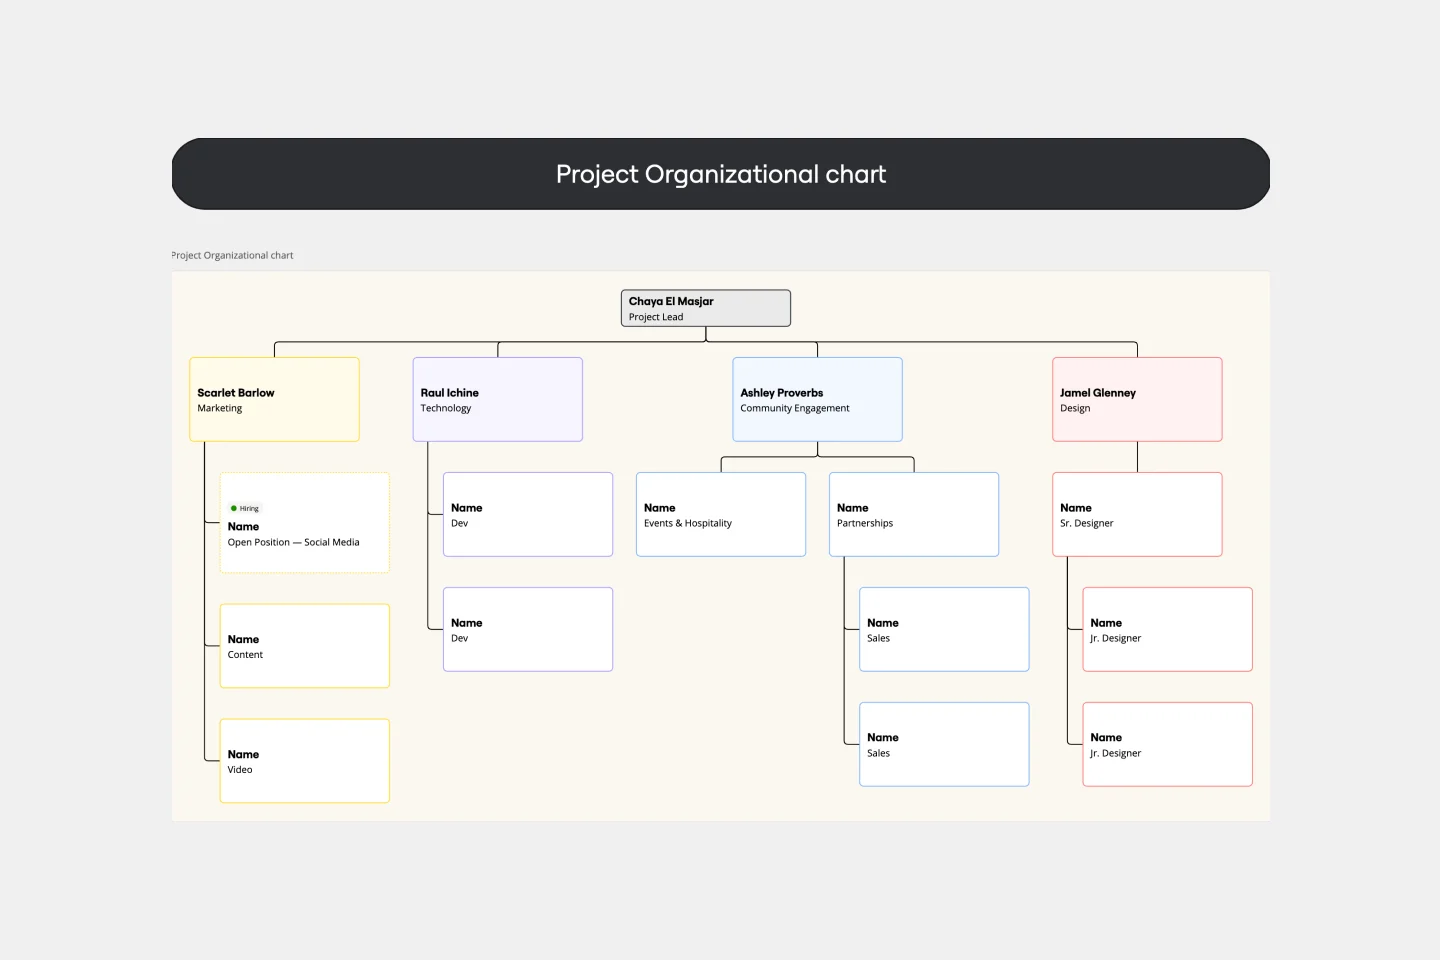
When you’re embarking on a long, complex project, you will inevitably hit roadblocks and obstacles. It’s important to have your project organizational chart on hand to overcome those challenges. A project organizational chart is a visual diagram that illustrates who is on your team and the role they play in a given project. It documents the structure of the project organization, the hierarchy between team members, and the relationships between employees. Project organizational charts are useful tools for clarifying who does what, securing buy-in, and setting expectations for the group.
UML Diagram Template
Works best for:
Diagrams, Software Development
Originally used as a modeling language in software engineering, UML has become a popular approach to application structures and documenting software. UML stands for Unified Modeling Language, and you can use it to model business processes and workflows. Like flowcharts, UML diagrams can provide your organization with a standardized method of mapping out step-by-step processes. They allow your team to easily view the relationships between systems and tasks. UML diagrams are an effective tool that can help you bring new employees up to speed, create documentation, organize your workplace and team, and streamline your projects.

Azure Architecture Diagram Template
Works best for:
Software Development, Diagrams
The Azure Architecture Diagram Template is a diagram that will help you visualize the combination of any data and build and deploy custom machine learning models at scale. Azure is Microsoft’s cloud computing platform, designed to provide cloud-based services such as remote storage, database hosting, and centralized account management. Use Azure Architecture Diagram template to build sophisticated, transformational apps.
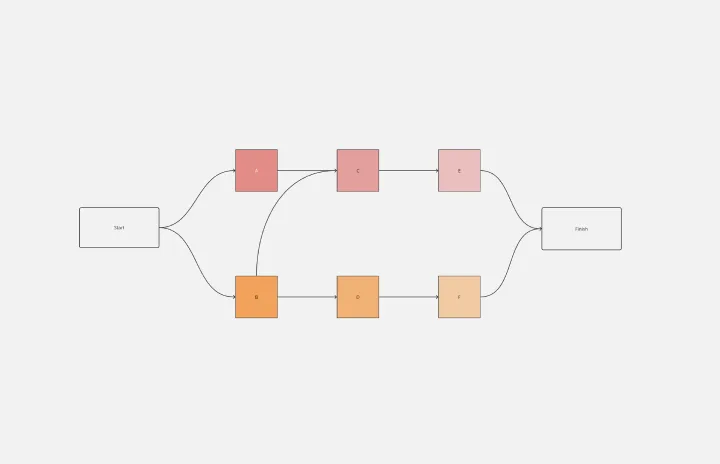
Precedence Diagram
Works best for:
Diagramming, Mapping
The Precedence Diagram Template offers a visual tool that maps out project activities and their interrelated sequences. This diagram empowers teams to recognize and anticipate workflow structures by illustrating the connections and dependencies among tasks.