Azure Architecture Diagram Template
This diagram will help you visualize the combination of any data and build and deploy custom machine learning models at scale.
Trusted by 65M+ users and leading companies


About the Azure Architecture Diagram template
The Azure Architecture Diagram Template will help you visualize and develop sophisticated, transformational apps using state-of-the-art machine learning algorithms. It will also allow you to create architecture diagrams, combine data, and build and deploy custom machine learning models at scale.
Keep reading to learn more about the Azure Architecture Diagram Template.
What is an Azure Architecture Diagram Template
The Azure Architecture Diagram Template, like any other network diagram, visually shows the steps of a given process, in this case, of the cloud architecture framework. The Azure Architecture Diagram has unique icons categorized into Stencils. Each Stencil focuses on a specific task to make it easier for users to access the right set of icons.
Azure helps to build, manage, and deploy applications. You can also use your preferred languages, frameworks, and infrastructure—even your data center and other clouds—to solve challenges large and small. Its framework consists of five pillars:
Cost optimization
Operational excellence
Performance efficiency
Reliability
Security
When to use Azure Architecture Diagram Template
You can use the Azure Architecture Diagram Template to transform your data into actionable insights. Microsoft Azure has a wide range of use cases that it serves. Here you can see the most common examples:
Analytics
DevOps
Networks
Security
Databases
How to create an Azure Architecture Diagram Template
Here you can see some of the best practices when building your own Azure Architecture Diagram template.
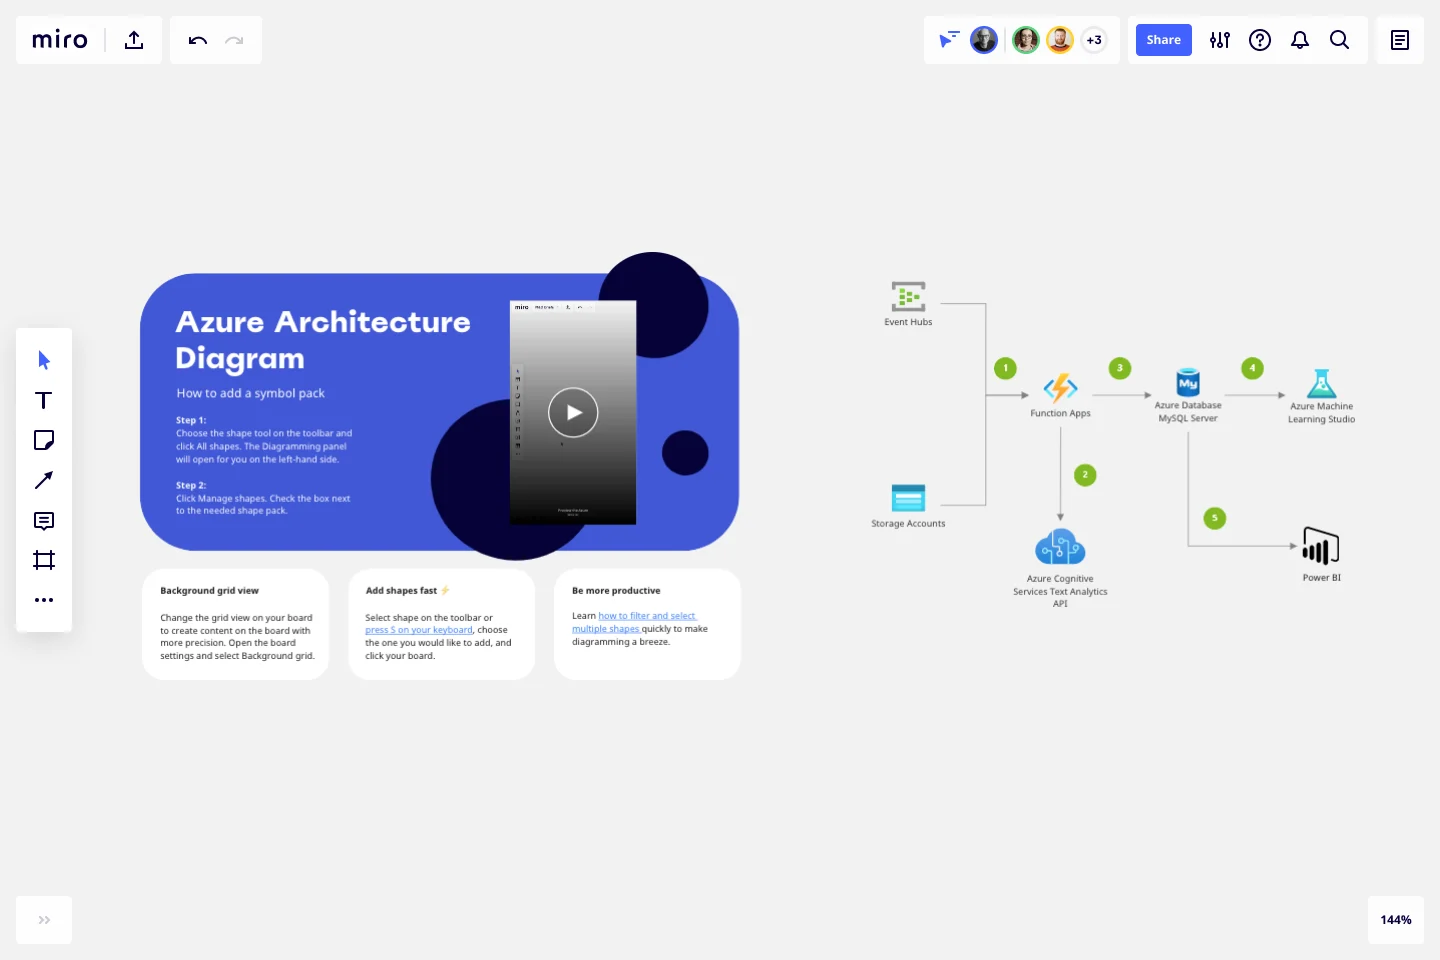
Data comes from various sources. Use the Events Hubs icon for high volumes of data ingestion or the Storage Account icon for data uploaded to Blob Storage.
Use Azure Function App icon to signalize calls to the Text Analytics API icon.
Add Azure Database for MySQL icon after Function Apps.
Add Azure Machine Learning Studio icon to show data is being further analyzed for more insights.
Add the Power BI icon to show how MySQL Power BI provides options for data visualization and analysis in Power BI.
If you are interested in creating other network diagrams, Miro is the perfect network diagram tool with several available shape packs and templates to suit your needs.
How do I create an Azure Architecture Diagram Template?
Creating an Azure Architecture Diagram in Miro is easy. You can use our Azure Architecture Diagram Template and customize it as you see fit. Once you have the diagram structure, you can start adding the icons. You can find the icons under our Azure Icon Set integration.
Get started with this template right now.
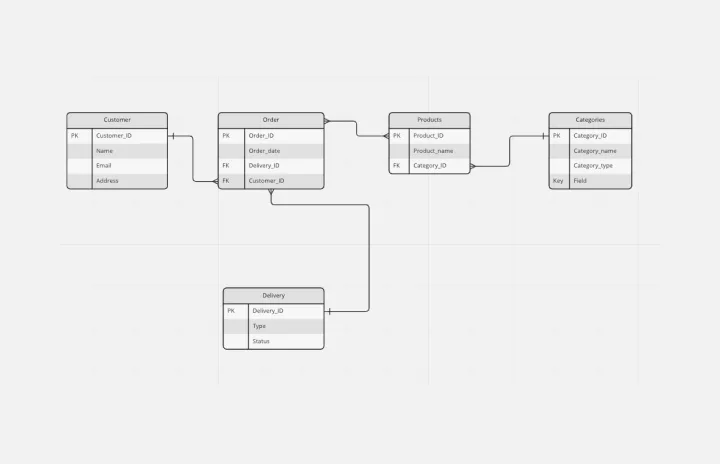
Entity Relationship Diagram Template
Works best for:
Flowcharts, Strategic Planning, Diagrams
Sometimes the most important relationships in business are the internal ones—between the teams, entities, and actors within a system. An entity relationship diagram (ERD) is a structural diagram that will help you visualize and understand the many complex connections between different roles. When will an ERD come in handy? It’s a great tool to have for educating and onboarding new employees or members of a team, and our template makes it so easy to customize according to your unique needs.
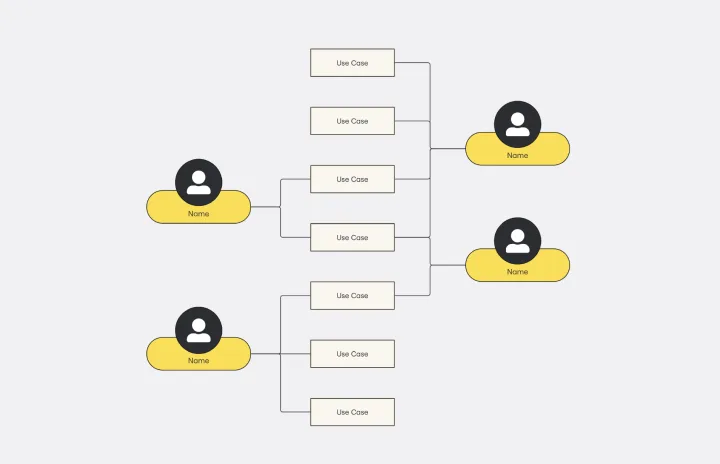
Use Case Diagram Template
Works best for:
Marketing, Market Research, Diagrams
A use case diagram is a visual tool that helps you analyze the relationships between personas and use cases. Use case diagrams typically depict the expected behavior of the system: what will happen and when. A use case diagram is helpful because it allows you to design a system from the perspective of the end user. It’s a valuable tool for communicating your desired system behavior in the language of the user, by specifying all externally visible system behavior.
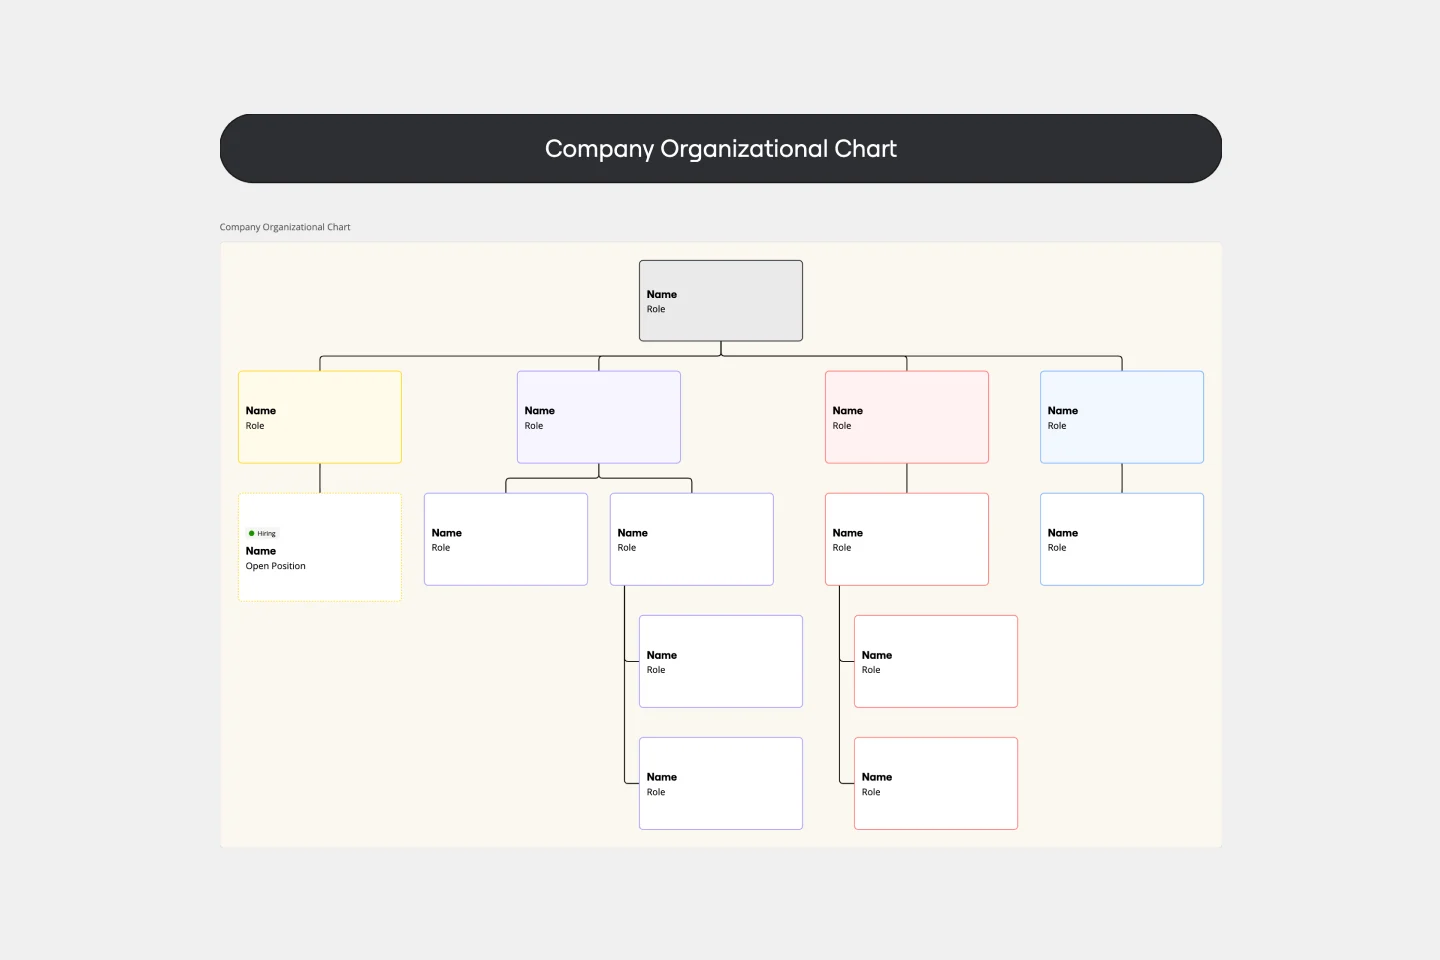
Company Organizational Chart
Works best for:
Org Charts, Operations, Mapping
An org chart is a visual guide that sums up a company’s structure at a glance—who reports to whom and who manages what teams. But it does more than just display the chain of command. It also showcases the structure of different departments and informs employees who to reach out to with issues and concerns. That makes it an especially valuable tool for new hires who are getting familiar with the company. Our templates make it easy for you to add your entire team and customize the chart with colors and shapes.
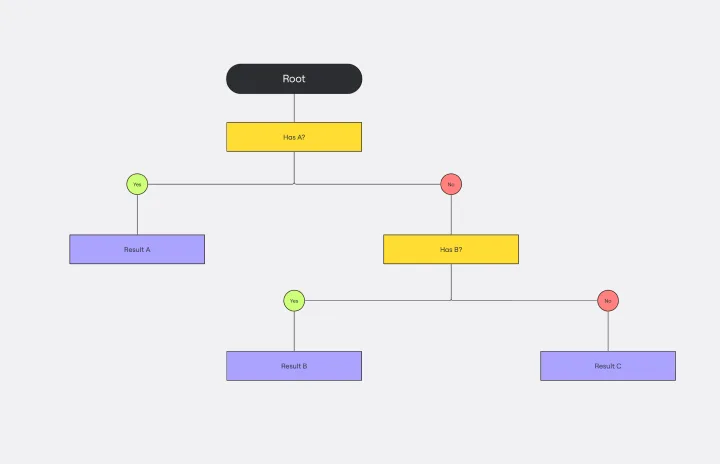
Dichotomous Key Template
Works best for:
Diagramming
The Dichotomous Key Template stands out as an exceptional tool for simplifying complex classification processes, significantly enhancing learning experiences. Breaking down intricate subjects into a series of binary decisions transforms how information is absorbed and understood. This systematic approach not only aids in retaining intricate details but also makes the learning process more engaging and interactive. Whether for educational purposes or professional use, the template’s design fosters a deeper comprehension of the subject matter, allowing learners and professionals to navigate complex scenarios with clarity and ease.

Disney Creative Strategy Template
Works best for:
Business Management, Ideation, Brainstorming
Know who knew a little something about coming up with ideas that set imaginations alight? Walt Disney. And he inspired the Disney Creative Strategy, an approach that establishes three types of thinkers—dreamers, realists, and critics—and gives each the space to do clear thinking. Your team will go through an engaging exercise of adopting the three mindsets, where they’ll focus on a specific aspect of the idea. The Disney Creative Strategy has a way of yielding brilliant ideas and great products. That’s why it’s used successfully by organizations of all kinds and sizes.
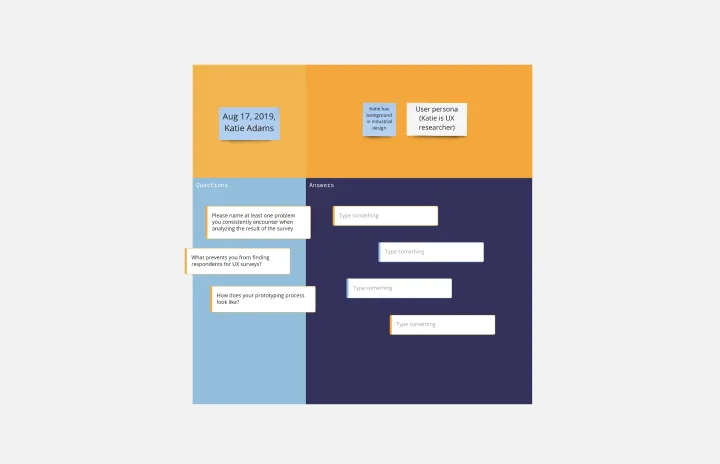
User Interview Template
Works best for:
Desk Research, Product Management
A user interview is a UX research technique in which researchers ask the user questions about a topic. They allow your team to quickly and easily collect user data and learn more about your users. In general, organizations conduct user interviews to gather background data, to understand how people use technology, to take a snapshot of how users interact with a product, to understand user objectives and motivations, and to find users’ pain points. Use this template to record notes during an interview to ensure you’re gathering the data you need to create personas.