Fault Tree Analysis Template
Bring clarity to complex scenarios with a Fault Tree Analysis. Streamline your approach to problem-solving and quickly identify system malfunctions.
Trusted by 65M+ users and leading companies


About the Fault Tree Analysis Template
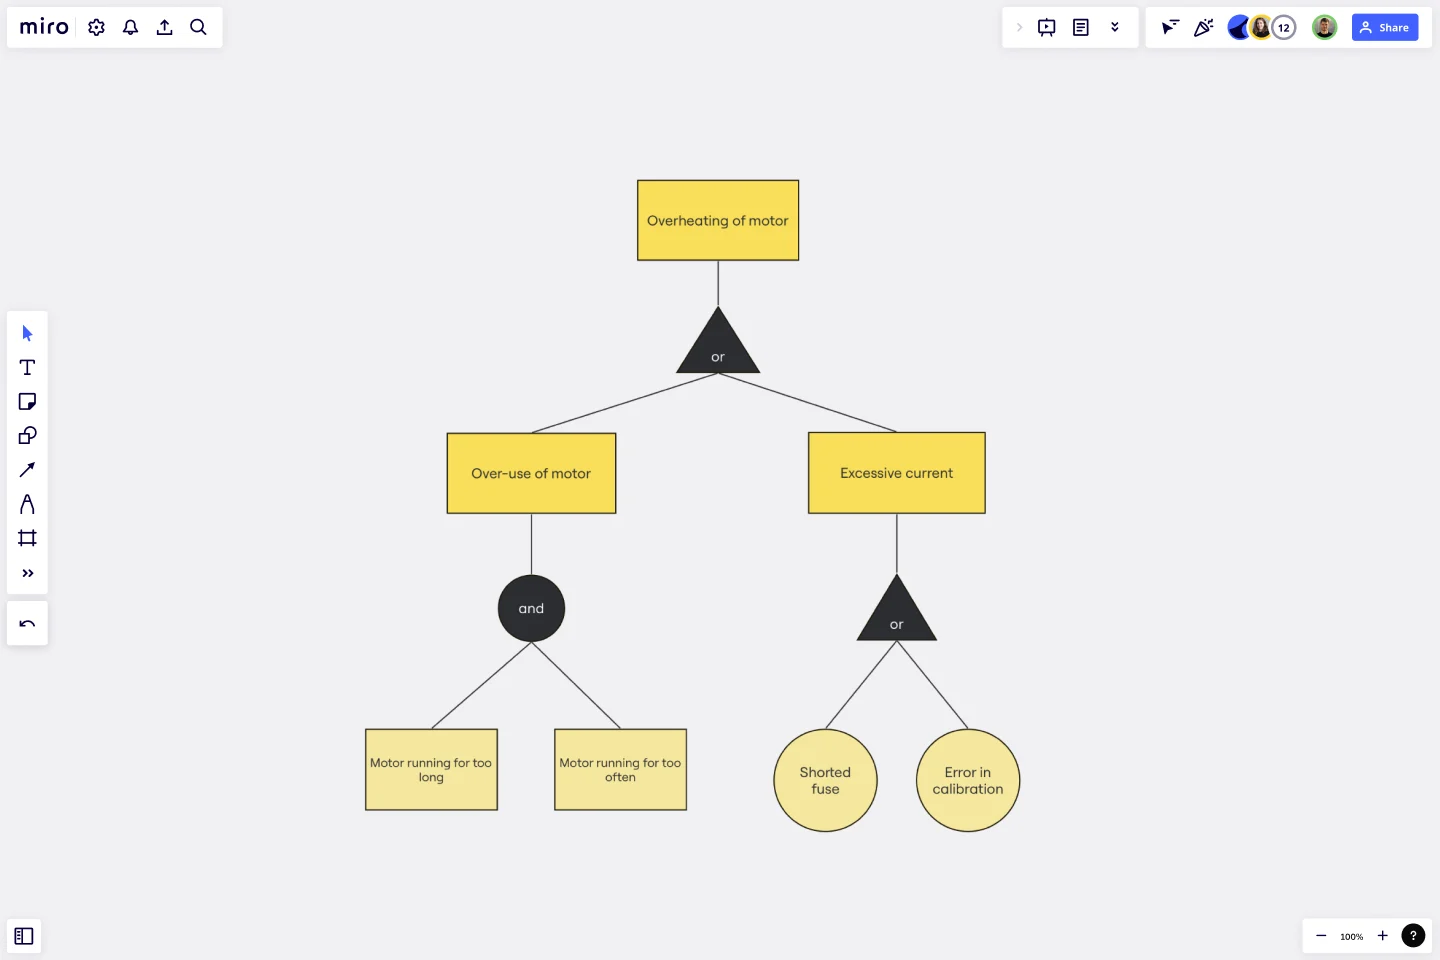
Navigating the complexities of system failures can be a daunting task. However, with the right tools, it becomes significantly easier. The Fault Tree Analysis (FTA) Template is an instrument designed to provide a structured approach to break down and analyze potential causes of system malfunctions visually.
What's a fault tree analysis template?
A fault tree analysis template is a diagrammatic representation of a system's possible malfunctions or failures. The template consists of a combination of logical symbols, visually breaking down the causes and effects and showcasing how one particular failure can result from various combinations of different losses. It's a powerful tool to identify vulnerabilities in any system or process.
Why use a fault tree analysis template?
Delving into the complexities of any system can reveal potential vulnerabilities. To efficiently navigate and address these vulnerabilities, it's crucial to have the right tool at hand. Here's why the fault tree analysis template is an essential tool for many professionals:
Clarity in complex situations: Fault tree diagrams present a visual map of potential problems and their root causes, making it easier to grasp intricate scenarios.
Predictive power: One can anticipate and mitigate risks by understanding the potential faults and their causal relations.
Efficient problem-solving: A clear view of all possible malfunctions helps prioritize interventions and target the most critical issues.
Enhanced communication: The visual nature of the template enables teams to have more structured and effective discussions about system vulnerabilities.
How to use the fault tree analysis template:
Leveraging the FTA template in Miro couldn't be easier.
Editing the template: Customize the template with a few clicks to tailor it to the specific complexities of your system or process. Change the content by double-clicking the shapes or editing the look and feel by clicking on the context menu bar.
Expansion: Develop the tree further by adding branches and nodes as you uncover more potential faults and their causes. Expand your fault tree by clicking on the shape and selecting the plus icon.
If you'd prefer to start from scratch, diagramming with Miro is easy. Choose from a wide range of diagramming shapes in Miro's extensive library, and start diagramming directly on your board.
Is the Fault Tree Analysis Template suitable for all industries?
From IT to manufacturing, healthcare to finance – the template can be customized to analyze failures across any system or process in any industry.
Can multiple team members collaborate on the FTA in real time?
Yes, Miro allows multiple users to collaborate on the board in real time, making it perfect for team discussions and brainstorming sessions.
How detailed should my FTA be?
The depth of your FTA depends on your specific needs. While a high-level overview can provide quick insights, a detailed analysis can help thoroughly understand and mitigate all potential risks.
Get started with this template right now.
4-Circle Venn Diagram Template
Works best for:
Diagramming, Mapping, Brainstorming
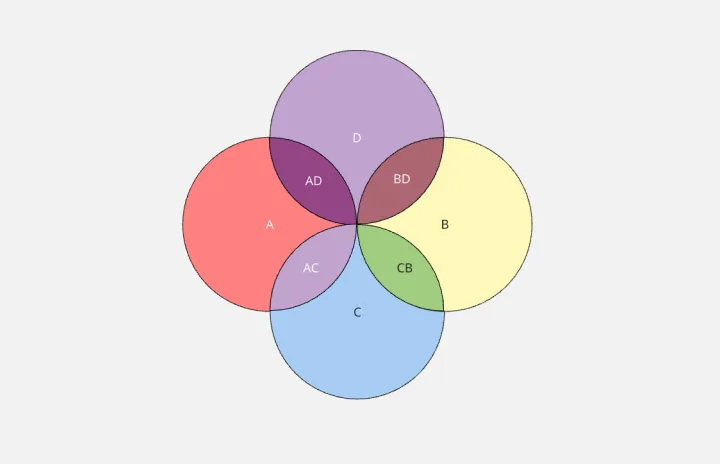
The 4-Circle Venn Diagram Template has an easy, interactive, and dynamic way to visualize complex relationships between data sets. Empower your team's collaboration and communication with this powerful tool.
Task Analysis Diagram Template
Works best for:
Diagramming
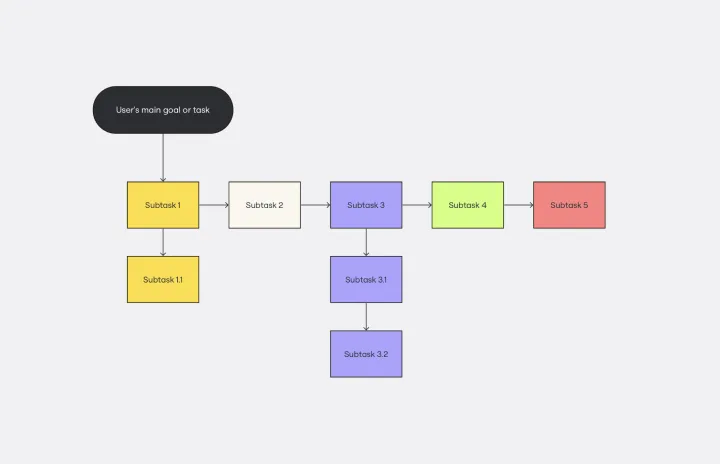
The Task Analysis Diagram Template is a helpful tool that simplifies complex tasks by breaking them down into smaller, more manageable steps. This strategic approach brings clarity and ensures a systematic method for tackling complex user paths. The template's most significant advantage is its precision, as it maps out every detail of a task to guarantee that nothing is missed. This results in more efficient operations.
Bubble Map Template
Works best for:
Diagramming, Mapping, Brainstorming
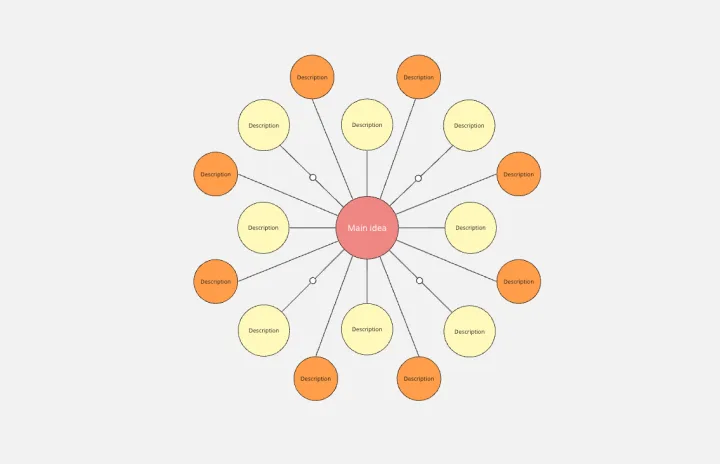
A Bubble Map Template is a visual organization tool that uses bubbles or circles to represent various ideas or data points. These bubbles are linked together, displaying their relationships and creating a network of interconnected thoughts. Use a Bubble Map Template to streamline complex information, enhancing comprehension and promoting efficient decision-making.
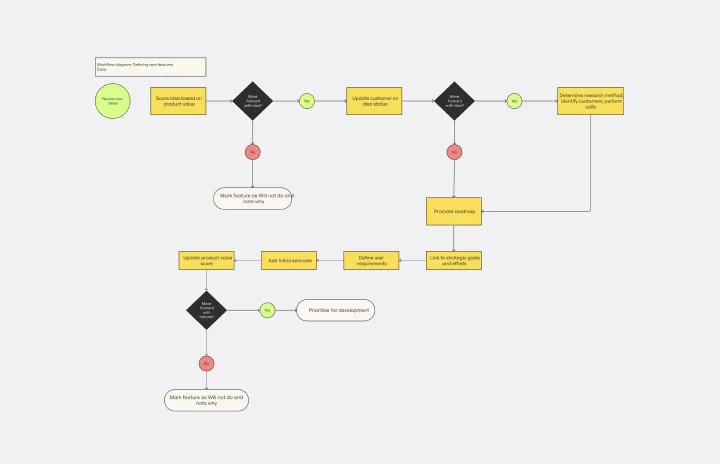
Workflow Diagram Template
Works best for:
Diagramming, Mapping, Process mapping
The Workflow Diagram Template maps out and represents processes or systems using standardized symbols and shapes. By delineating the various steps or stages in a process, it ensures that tasks flow seamlessly from initiation to completion. One of the standout benefits of using this template is its clarity. By translating processes into a visual format, all participants can gain a comprehensive understanding at a glance, eliminating confusion and ensuring everyone is on the same page. This clarity not only promotes efficient task execution but also fosters collaboration among team members.

Production Flowchart Template
Works best for:
Diagramming, Flowcharts
The Production Flowchart Template is a well-crafted tool that clearly represents a production process from start to finish. It breaks down complex procedures into easy-to-understand segments, making it easier for stakeholders to grasp the entire process. One of the key benefits of using this template is that it helps to clarify complex production pathways. By mapping out operations visually, teams can identify potential bottlenecks or inefficiencies, facilitating timely and well-informed decision-making.

Stage-Gate Process Flowchart Template
Works best for:
Diagramming, Project Management
The Stage-Gate Process Flowchart Template structures a project into distinct stages separated by decision-making gates, enhancing the quality of decisions and leading to more successful project outcomes.