Family Tree Template
Uncover your family lineage and learn more about your genealogy.
Trusted by 65M+ users and leading companies


About the Family Tree Template
Understanding your family genealogy can be difficult. A family tree simplifies this by giving you a birds-eye view in a simple and easy-to-understand format. It also allows you to add people and other information as you learn more about your family.
Keep reading to learn more about our Family Tree Template.
What is a family tree?
A family tree is a visual representation of someone’s lineage and genealogy. Through nodes and lines that represent marriage and blood relationships, a family tree presents a thorough record of family history. It shows your direct ancestors, but it can also branch out much further than that and include anyone you’re related to.
Typically, the creator of the family tree serves as the starting point. All relatives are included in the family tree relative to this person.
Other times, genealogists or historians might create family trees to help them understand the family relationships of a historically significant person.
Benefits of creating a family tree
First and foremost, family trees serve as a record of your family history. You’ll be able to track birth, marriage, and death dates, as well as other life events like moves or emigrations.
As you build your family tree, you’ll likely uncover new stories about your family that you’ve never heard before. This helps you get a fuller picture of what your family looked like in past generations.
Create your own family tree
You don’t need much information to create a family tree. As long as you have a few family names, you can build out the foundation of your family tree.
Open up the Family Tree Template to get started or use Miro's tree diagram maker, then follow these steps.
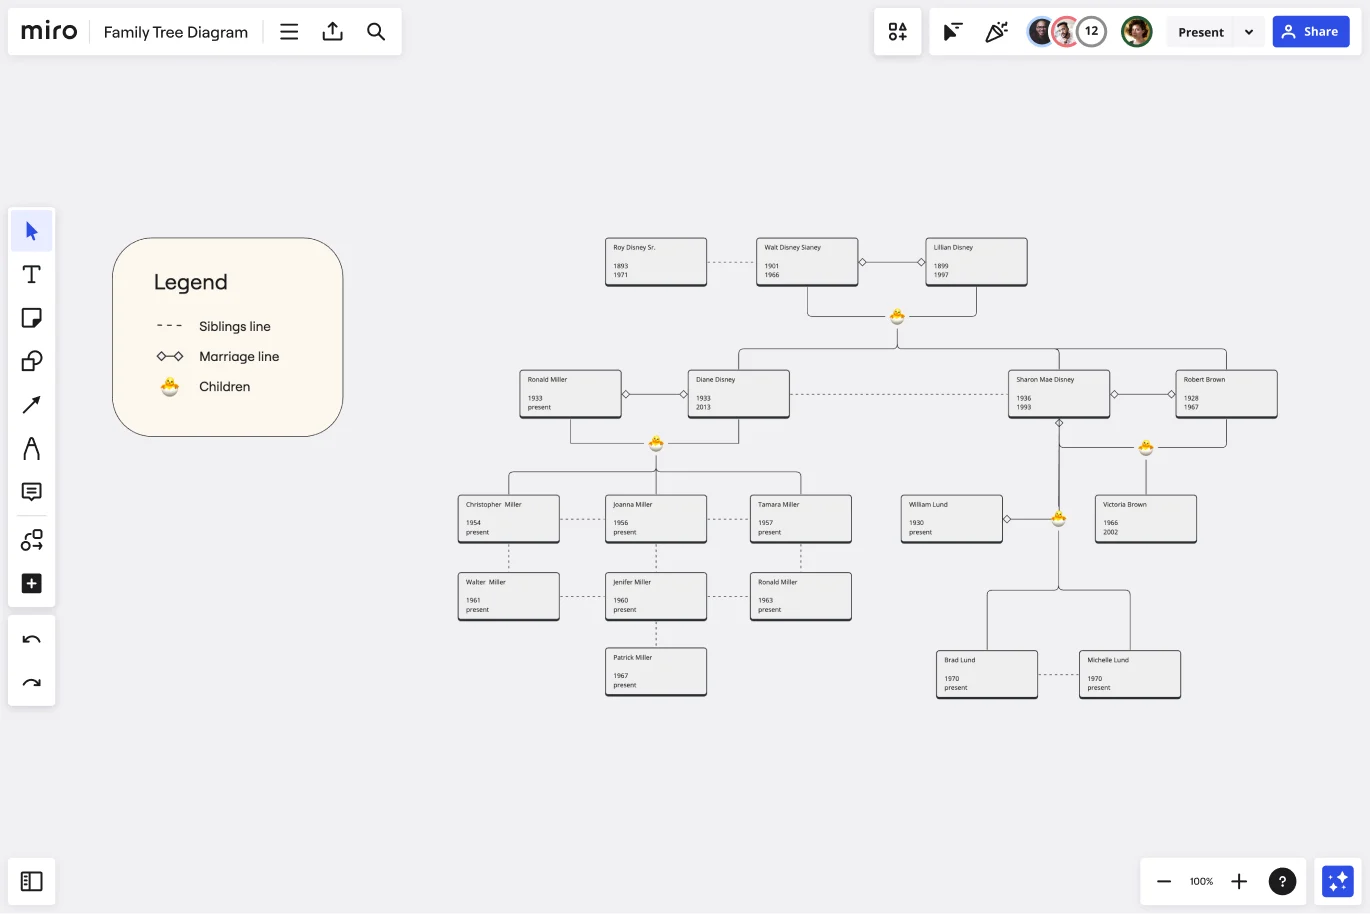
Step 1: Write your name as the starting point for your family tree. If you’re creating the family tree for your child or a historical figure, start with the main subject of your diagram.
Step 2: Start with your immediate family. Use dotted lines to connect yourself to your siblings and a solid line to connect yourself to your parents. In our simple Family Tree Template, parent/child relationships are also labeled with a small chick icon.
Since you likely know a lot about your immediate family members, feel free to fill in extra information as you go. You can add birth and death dates, married or middle names, and anything else you want to follow up on in your family history research.
Step 3: Add your extended relatives. You might start with your grandparents, aunts and uncles, and cousins, or you might add your sibling’s spouses and children.
As you build out your family tree, it’s smart to begin with the sides of the family you’re most familiar with. You’ll get comfortable building out your family tree and can put those skills to good use as you dive deeper into your family history.
Step 4: Add any extra information. Family tree charts can be as simple or as complex as you’d like. To make them as useful and interesting as possible, add images, create graphs, or include any extra information about your relatives.
You can find birth, death, and marriage records online pretty easily. Plenty of records are publicly available online or through local libraries and historical societies. Census data can also be incredibly helpful, as it confirms where your family was living at certain times.
You can also collaborate on building your family tree by sharing your diagram with other family members and getting them to fill in any blanks.
Step 5: Build onto your tree as much or as little as you’d like, or create more trees. Don’t be surprised if genealogy research becomes a full-fledged hobby for you.
Your family tree chart can expand as you discover additional information about your family history. You can even expand it into a genogram, which helps you represent family patterns, conflicts, and timelines in addition to basic data.
We've created a definitive guide to family tree diagrams that covers the basics and more in-depth topics. It also delves into other diagrams that borrow from the family tree structure but are used for different work processes.
When to use a Family Tree Template
Family trees can come in handy any time you’re researching your family history.
Your child might make a family tree for a school project to help them understand their closest relatives. Or, you could create one to identify gaps in your ancestry research that need more attention and resources.
What’s most important is to use a Family Tree Template like Miro’s that allows you to expand and refine your family tree as often as you need. You never know when you might discover a new relative or a surprising family story.
Who is the first generation in a family tree?
Family tree charts work backward from the most recent generation you want to trace. If you’re creating your own family tree, you’ll be the first generation listed on the family tree. Everyone else is listed in relation to you.
How far back can a family tree be traced?
Many people will be able to trace their family trees back to the mid-1800s, when communities began to purposefully keep public records of births, marriages, and deaths, among other things. Prior to that, you’ll have to depend on family records, such as letters. Some people can trace their family pedigree back to the 1600s or earlier. You’re more likely to be able to trace your family tree back this far if your ancestors attended church, owned land, or were otherwise wealthy.
Get started with this template right now.

UML State Machine Diagram Template
Works best for:
Software Development, Mapping, Diagrams
Visualize the workflow of a process and how objects perform actions based on different stimuli. State machine diagrams are valuable for understanding how an object responds to events at the different stages of its life cycle. They are also helpful for visualizing event sequences in a system.
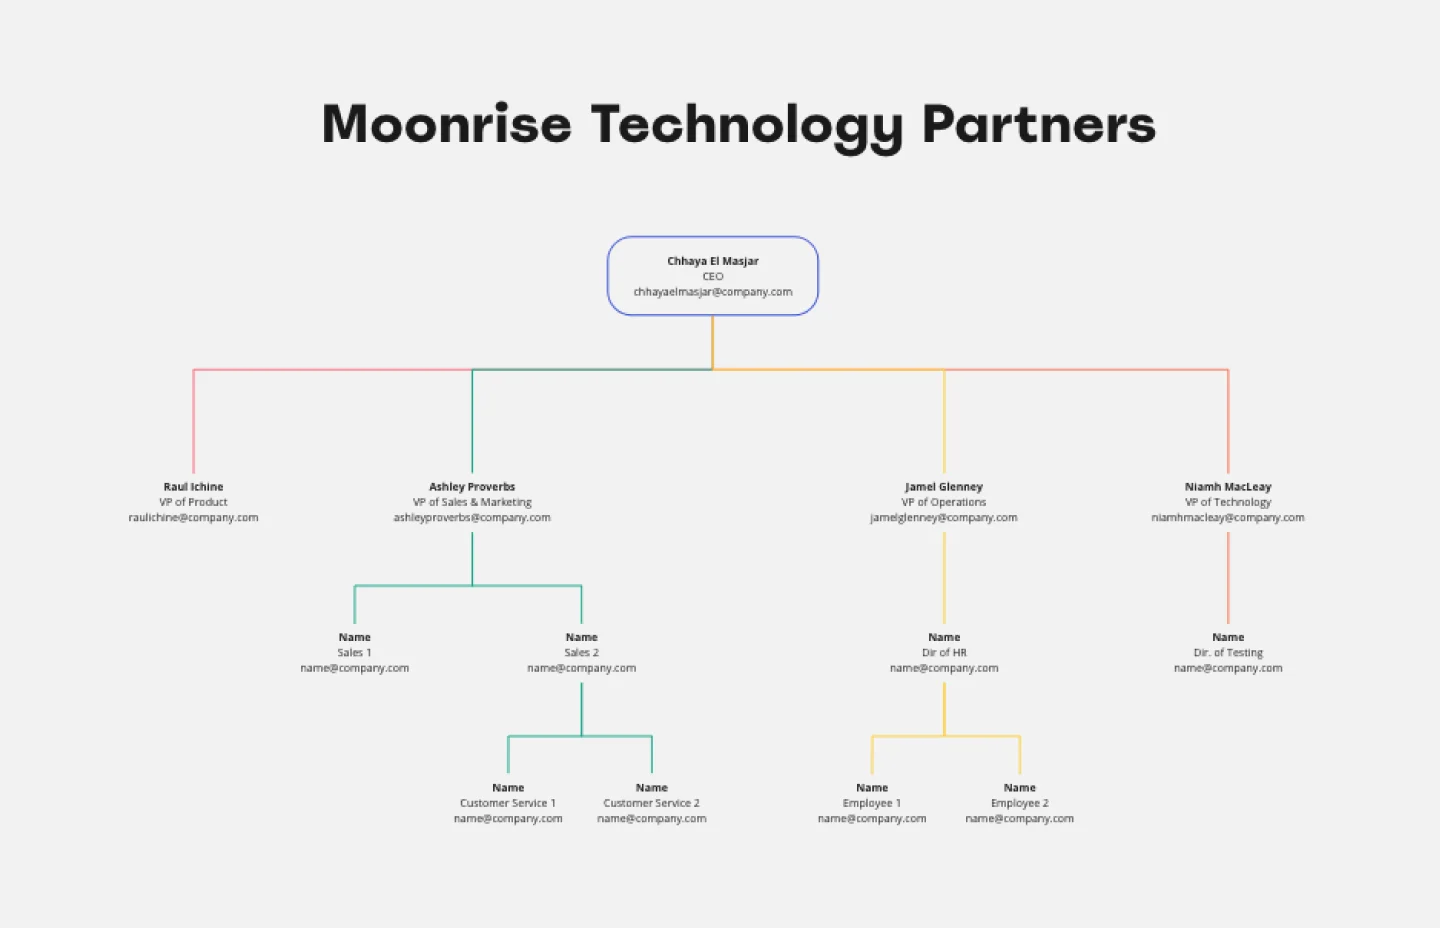
Company Organizational Chart
Works best for:
Org Charts, Operations, Mapping
An org chart is a visual guide that sums up a company’s structure at a glance—who reports to whom and who manages what teams. But it does more than just display the chain of command. It also showcases the structure of different departments and informs employees who to reach out to with issues and concerns. That makes it an especially valuable tool for new hires who are getting familiar with the company. Our templates make it easy for you to add your entire team and customize the chart with colors and shapes.
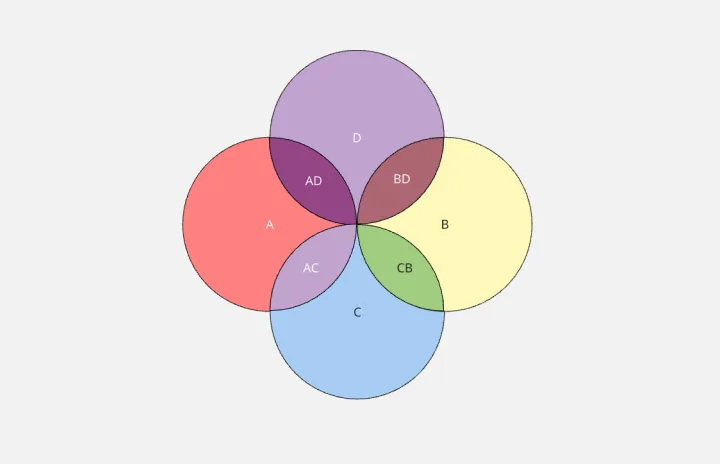
4-Circle Venn Diagram Template
Works best for:
Diagramming, Mapping, Brainstorming
The 4-Circle Venn Diagram Template has an easy, interactive, and dynamic way to visualize complex relationships between data sets. Empower your team's collaboration and communication with this powerful tool.
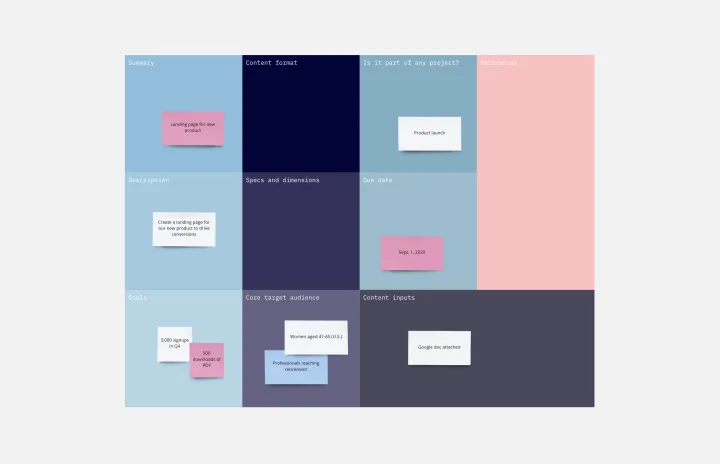
Creative Brief Template
Works best for:
Design, Marketing, Desk Research
Even creative thinkers (or maybe especially creative thinkers) need clear guidelines to push their ideas in productive, usable directions. And a good creative lays down those guidelines, with information that includes target audience, goals, timeline, and budget, as well as the scope and specifications of the project itself. The foundation of any marketing or advertising campaign, a creative brief is the first step in building websites, videos, ads, banners, and much more. The brief is generally prepared before kicking off a project, and this template will make it easy.
Design Research Template
Works best for:
UX Design, Design Thinking, Desk Research
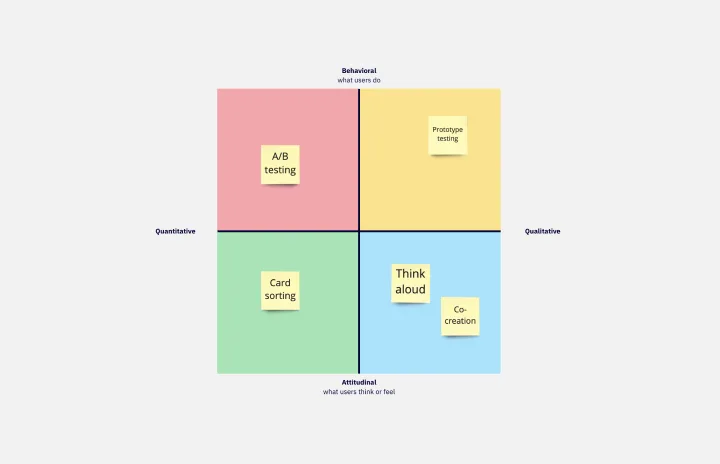
A design research map is a grid framework showing the relationship between two key intersections in research methodologies: mindset and approach. Design research maps encourage your team or clients to develop new business strategies using generative design thinking. Originally designed by academic Liz Sanders, the framework is meant to resolve confusion or overlap between research and design methods. Whether your team is in problem-solving or problem space definition mode, using a research design template can help you consider the collective value of many unrelated practices.
Block Diagram Template
Works best for:
Mapping, Software Development, Diagrams
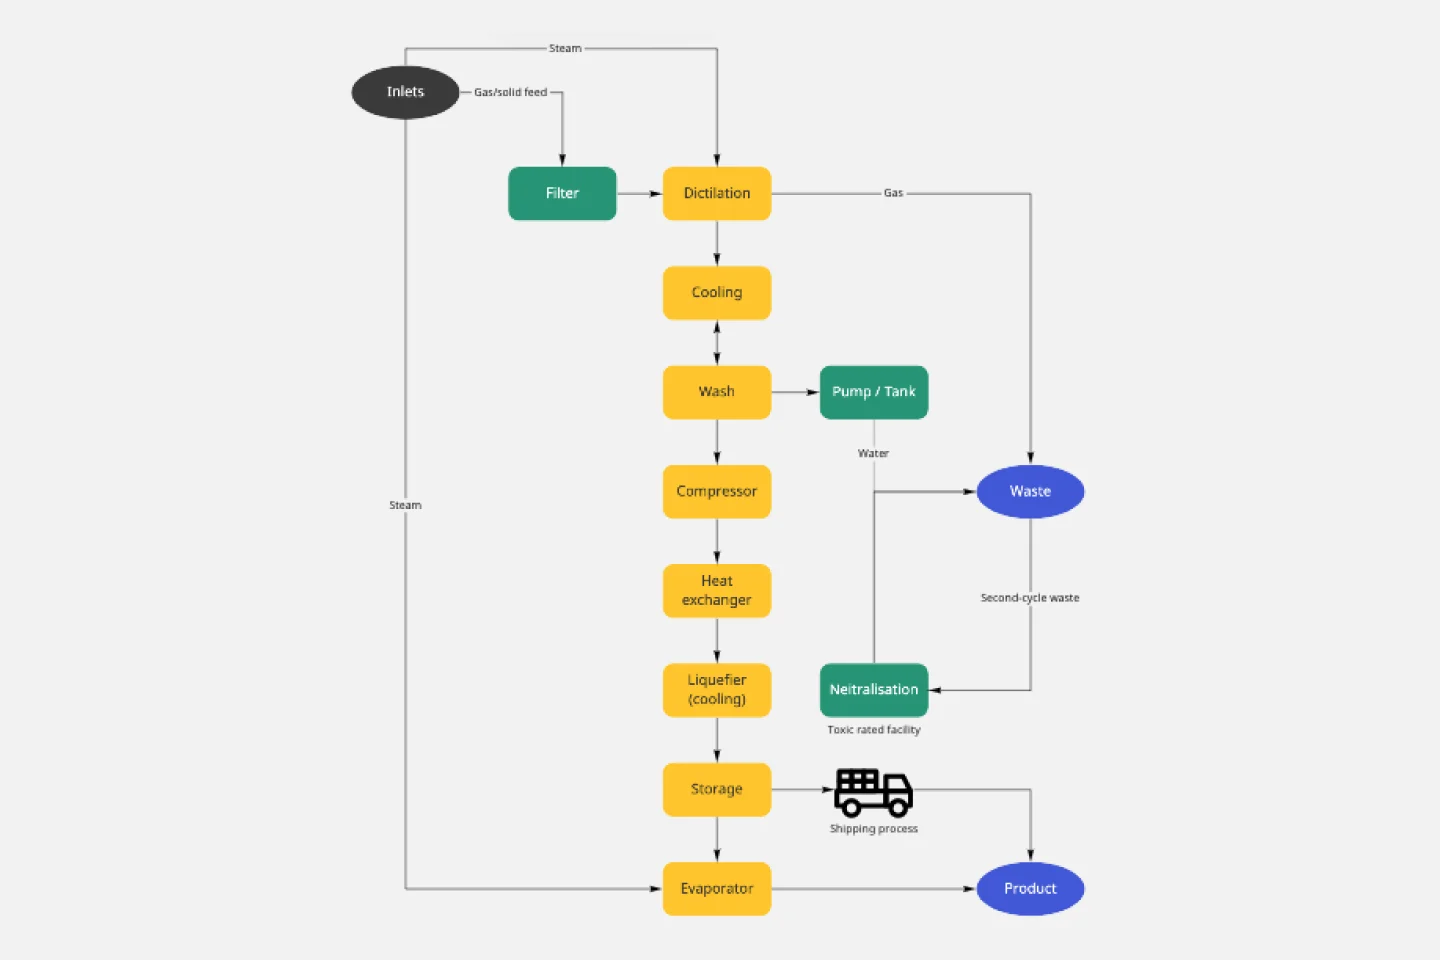
Use this template to illustrate technical systems. Blocks represent important objects in the system, and arrows demonstrate how the objects relate to each other. Perfect for engineers, workflow managers, or anyone trying to build a better process.