UML State Machine Diagram Template
Visualize the different stages of an object or system using a UML state machine diagram template.
Trusted by 65M+ users and leading companies


About the UML State Machine Diagram Template
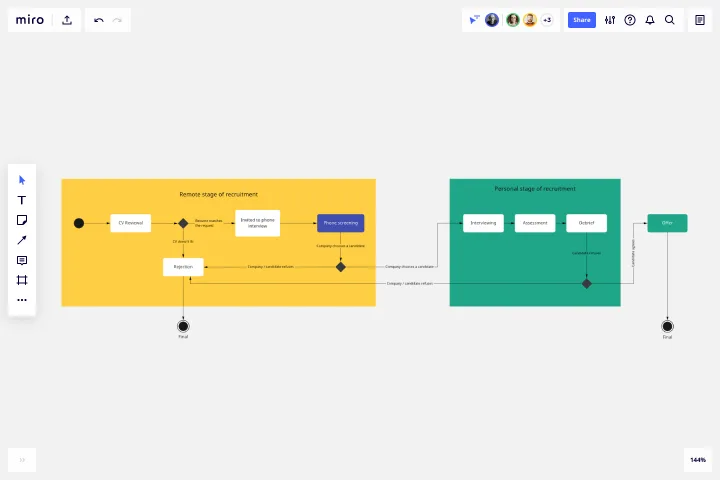
Miro’s UML state machine diagram template is a visual tool you can use to illustrate an object or system’s various states and how it transitions from one to another. State machine diagrams are especially useful for software engineers and system architects looking to understand, design, and communicate complex state transitions and interactions — such as seeing how a web service responds to different requests.
In the next section, we’ll walk you through how to use the UML state machine diagram template.
How to use the UML state machine diagram template
To get started, click on the “use template” button to open the UML state machine diagram template in Miro. Once you’re in, follow these steps to start filling it in:
1. Define states and objects
Define your possible states and the objects that belong to them. Use the shapes in the template to represent each state by double-clicking on the text boxes to edit them.
For example, if you’re creating a behavioral state machine diagram for an elevator system, you could define the states as 'Not activated,' 'Waiting for user input,' and 'Moving up' or ‘Moving down.’
2. Connect states to objects
Once you’ve defined your states, connect them with the correct objects. For example, for a UML state machine diagram representing an elevator system, you’d connect the ‘Move Up’ object to the 'moving up' state and the ‘Move Down’ object to the 'moving down' state.
Use the arrows in the state machine diagram template to link states and objects. Rearrange, duplicate, and remove them as needed.
3. Add transition actions and conditions
Once you connect the states with the objects, fill in the appropriate actions for each state. For example, if your elevator diagram has a state called 'waiting for user input,’ instruct the user on what they should do next. Double-click on the text boxes you want to edit to replace them with your own actions and outcomes.
4. Define guard conditions
Finally, add guard conditions or actions that would trigger your transitions. For example, if an elevator is moving upward and the user presses the 'down' button, this action would trigger the elevator to move back to its 'waiting for user input' state.
In the state machine diagram template, double-click on a textbox along an arrow connecting two states and add the appropriate guard condition.
Miro is also the perfect state diagram maker if you'd prefer to diagram from scratch. Simply use Miro's diagramming tool and UML shape pack.
What is the state machine diagram template for?
A state machine diagram template helps you visualize a software’s different states and how it transitions between them. Take video games, for example. If you’re designing a video game, a state machine diagram will help show how the user will move through the different stages of playing.
Can I build a state machine diagram from scratch?
Absolutely. Miro makes it easy to build a state machine diagram from scratch using our automated diagramming and mapping tools and user-friendly interface. Drag and drop the shapes you need onto your canvas, add connection lines to depict transitions, and use text boxes to add labels.
Does Miro have a free UML diagramming shape pack?
Miro offers plenty of free shape packs to equip you with all the diagramming tools you need — though you’ll need a Business, Enterprise, or Education plan to access our UML shape pack.
Get started with this template right now.

Opportunity Solution Tree Template
Works best for:
Flowcharts, Product Management, Diagrams
Solving problems — successful companies and productive teams just know how to do it. They’re able to identify many possible solutions, then settle on the one that leads to the desired outcome. That’s the power an Opportunity Solution Tree gives you. Designed by Teresa Torres, a product discovery coach, this mind map breaks down your desired outcome into opportunities for the product to meet user needs, then gives your team an effective way to brainstorm potential solutions.
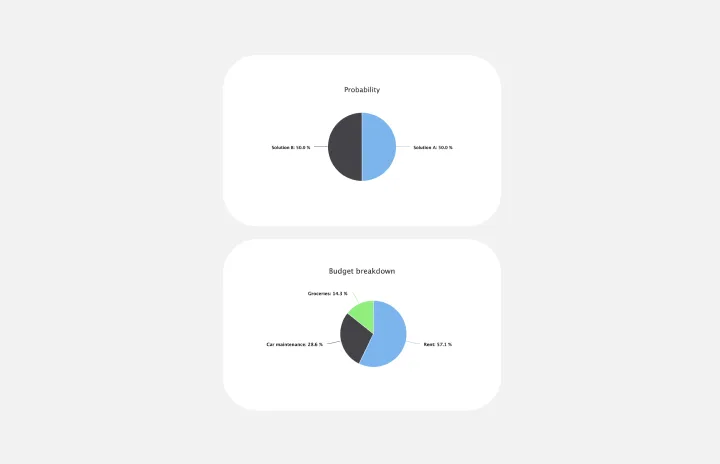
Pie Chart Template
Works best for:
Education, Operations
Pie charts are an excellent way to present relationships between datasets graphically, where you can quickly compare information and see contrast right away. Professionals from many fields use pie charts to support their presentations and enrich their storytelling as it’s one of the most commonly used data charts.

Cross Functional Flowchart
Works best for:
Flowcharts, Org Charts, Business Management
Have a quick look at everyone on a project and see exactly what they’ll contribute. That’s the clarity and transparency a cross-functional flowchart will give you. These are also called “swim lane” flowcharts because each person (each customer, client, or representative from a specific function) is assigned a lane—a clear line—that will help you visualize their roles at each stage of the project. This template will empower you to streamline processes, reduce inefficiencies, and make meaningful cross-functional relationships.
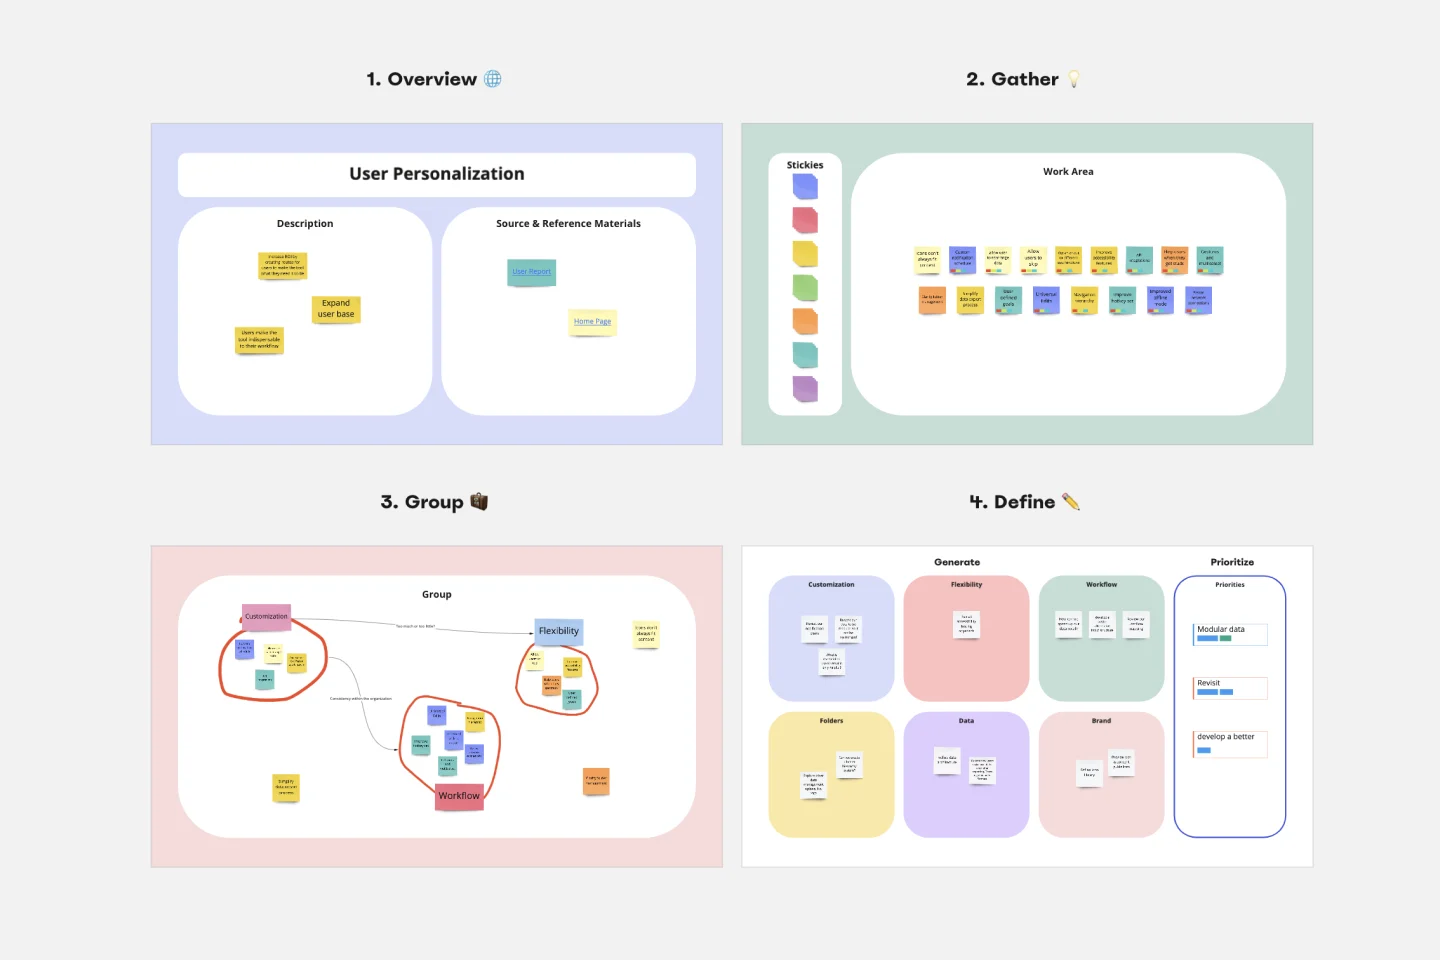
Affinity Diagram Template
Works best for:
Desk Research, Mapping, Product Management
You can use an affinity diagram to generate, organize, and consolidate information that comes out of a brainstorming session. Whether you’re building a product, working through a complex problem, establishing a process, or piecing apart an issue, an affinity diagram is a useful and simple framework that gives each team member the opportunity to pitch in and share their thoughts. But it’s not just ideal for brainstorms—this is a great template and tool when you need to reach consensus or analyze data such as survey results.
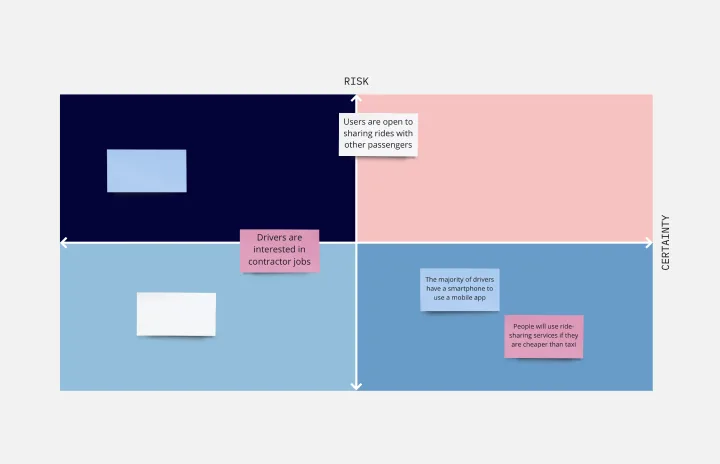
Assumption Grid Template
Works best for:
Leadership, Decision Making, Strategic Planning
Someone wise once said that nothing in life is certain. But the waters of the business world? It can seem especially uncertain and unclear. An Assumption Grid can help you navigate those waters and make your decisions confidently. It organizes your business ideas according to the certainty and risk of each — then your team can discuss them and make judgment calls, prioritize, mitigate risk, and overcome uncertainties. That’s why an Assumption Grid is a powerful tool for getting past the decision paralysis that every team occasionally faces.
Kinship Diagram Template
Works best for:
Mapping, Diagrams
Use a Kinship Diagram Template to map out a clear picture of your family relationships. With clear guidelines for kinship notation, you can navigate everything from your closest uncle to your third cousin twice removed. Try the Kinship Diagram Template to understand your family relationships.