HEART Framework Template
Evaluate customer satisfaction and ensure that you are providing real value with the HEART Framework. Measure Happiness, Engagement, Adoption, Retention, and Task Success.
Trusted by 65M+ users and leading companies


About the HEART Framework template
The HEART framework is a UX framework developed by Google. It turns the often-fuzzy idea of user experience into a set of measurable, actionable metrics, helping your product win new users and keep current active users loyal.
What is the HEART framework?
User experience teams often find it challenging to develop useful metrics for success. It’s an even greater challenge for teams at large companies. You can measure user experience at a small scale through user research, surveys, and focus groups. But as your company grows, your customer base gets too large for these methods to always be reasonable.
Google developed the HEART framework to tackle the problem of quantifying user experience. The HEART framework is a set of user-centered metrics you can use to measure user experience at any scale — then draw on those metrics repeatedly throughout the product development lifecycle.
What does HEART stand for?
HEART stands for Happiness, Engagement, Adoption, Retention, and Task Success.
Happiness is a subjective measure of attitude or satisfaction. It’s often quantified through user surveys and bolstered via case studies.
Engagement measures how much the user interacts willingly with a product. Depending on the product, it can be measured by your number of active users in a day, week, or month or your net promoter score (NPS).
Adoption is the rate of new users gained in each time period, usually monthly.
Retention measures how long each customer remains an active user before dropping off. Churn, the other side of the coin, measures how many active users go inactive each month.
Task Success is either the average time it takes a user to complete a task in your product or the percentage of tasks users successfully complete.
What are goals, signals, and metrics in HEART?
Goals, signals, and metrics are the core of the HEART process. All five areas of the HEART acronym must be connected to a goal, at least one signal, and at least one metric.
A goal is a statement of what you’d like your product to achieve in that area of HEART. It’s important for goals to be general, not defined by existing metrics. Some examples:
Happiness goal: “We want logging into our product to feel relaxing and supportive.”
Engagement goal: “We want users engaging with our app every day.”
Adoption goal: “We want our user base to grow continuously.”
Retention goal: “We want as little churn as possible.”
Task Success goal: “We want to minimize abandoned tasks across all user segments.”
Next, come up with one or more signals for each goal. Signals are signs you can look for to show you whether you’re on track to achieve your goal. Examples might be:
Happiness signals: Positive feedback from with real users, recommendations, few complaints.
Engagement signals: Large amount of user-generated content, users spending more time in the app, users logging in multiple times per day.
Adoption signals: More downloads, new features adopted quickly, paid features generating more revenue.
Retention signals: More subscription renewals, fewer users going inactive.
Task Success signals: Few abandoned tasks, few complaints about time-to-completion.
Finally, decide on metrics you can use to objectively measure each signal. For example:
Happiness metrics: Number of five-star reviews, NPS.
Engagement metrics: Daily/weekly/monthly active users.
Adoption metrics: New users per day/week/month, revenue from paid users.
Retention metrics: Retention rate, churn rate.
Task Success signals: Tasks completed per user, average completion time.
The HEART framework is not prescriptive. You’re free to come up with whatever goals, signals, and metrics make the most sense for your business and product.
How do you create a HEART model?
Start by selecting the HEART framework template. Then follow these steps:
Decide on your scope. Are you evaluating your whole product, certain features, or just one feature?
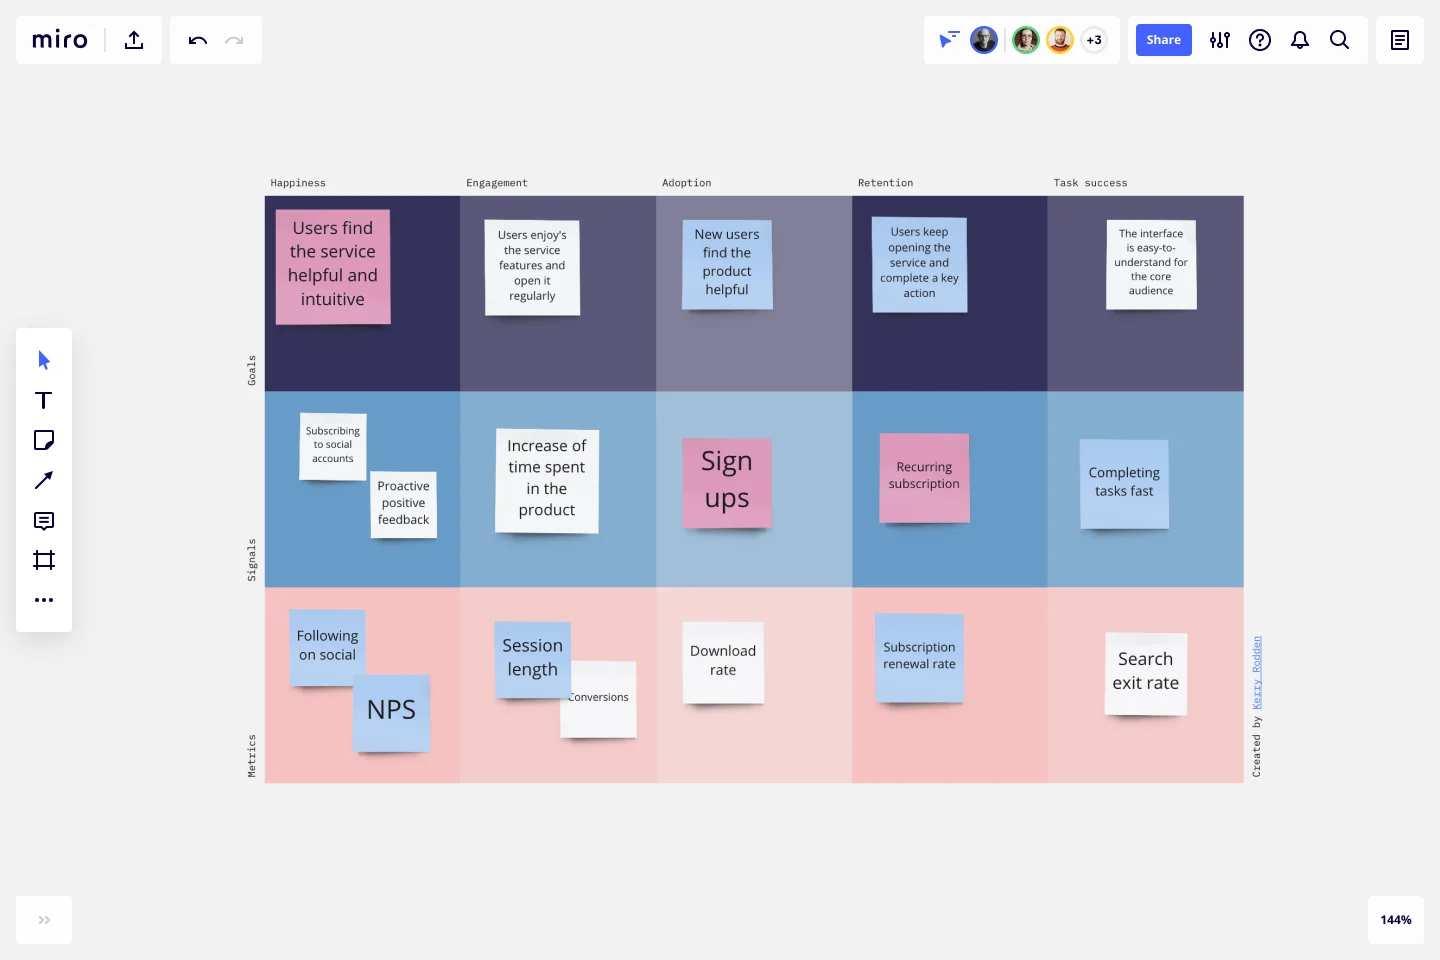
Get familiar with the template. The five areas are listed at the top of the table. Goals, signals, and metrics run down the left-hand side.
Fill out goals for each column. Brainstorm or with your team to settle on five goals.
Fill out signals. Signals can be either positive (something you want to see) or negative (something you’re on the right track if you don’t see).
Fill out metrics. Pick metrics you can use to quantify each signal.
Alternately, you might choose to come up with goals, signals, and metrics for each column before moving on to the next one. Either approach works!
Once finished, you can share your framework with your team or anyone else who would benefit from seeing the information by sending them the board link.
When should you use the HEART model?
The HEART model is generally used to measure larger scale projects, but it works for any size project or team. Use it whenever you want to ensure you’re making your customers happy and providing them with real value.
What are UX frameworks?
A UX framework is a set of assumptions and steps a team can use to build a user experience. UX frameworks such as HEART also monitor and refine user reactions to a product once it’s already out in the world.
What is a KPI in UX design?
A KPI, or key performance indicator, is a measurable variable a UX team can use to determine how their user interface is performing with customers. In the HEART framework, it’s called a metric. Examples include monthly active users and time to complete tasks.
What is UX tracking?
UX tracking is the act of using tools to follow how users interact with your product. It encompasses a wide range of technology, including website analytics, click-tracking, and A/B testing apps.
How do you use the HEART framework?
The easiest way is to use this free template. Alternatively, create a table and label one axis with Happiness, Engagement, Adoption, Retention, and Task Success. Label the other axis with Goals, Signals, and Metrics. Then, work with your UX team to fill in each cell.
Get started with this template right now.
Three-Hour Brand Sprint Template
Works best for:
Marketing, Workshops, Sprint Planning
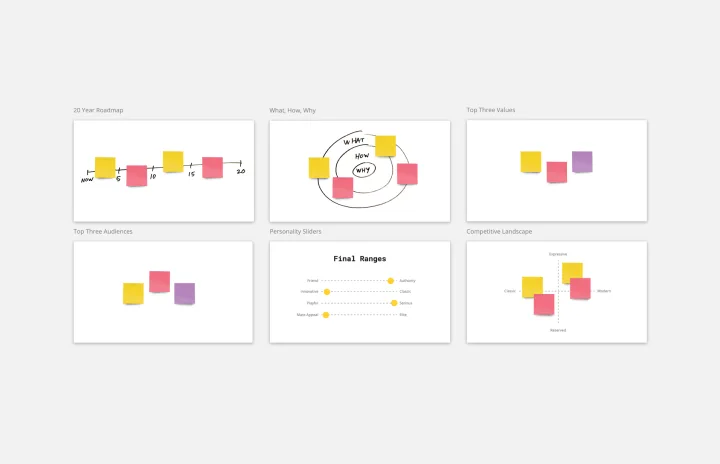
Before customers will believe in your brand, your team has to believe. That’s where brand sprints work wonders. Popularized by the team at Google Ventures, a brand sprint will help your team sort through all different ideas about your brand and align on your brand’s fundamental building blocks—your values, audience, personality, mission statement, roadmap, and more. Whether you’re building a new brand or revamping an existing one, brand sprints are ideal for trigger events such as naming your company, designing a logo, hiring an agency, or writing a manifesto.
Project Status Report Template
Works best for:
Project Management, Documentation, Project Planning
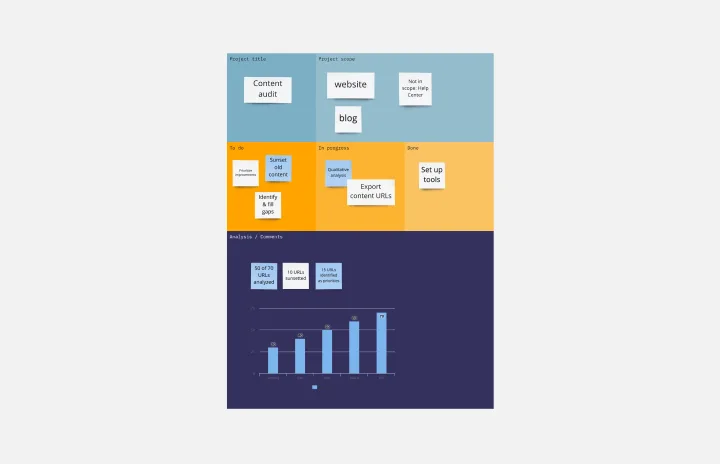
When a project is in motion, the project manager must keep clients and shareholders updated on the project’s progress. Rather than waste time with constant meetings, leaders can send out weekly or daily project status reports to keep everyone informed. You can use the Project Status Report Template to streamline the report creation and distribution process.
Creative Brief Template
Works best for:
Design, Marketing, Desk Research
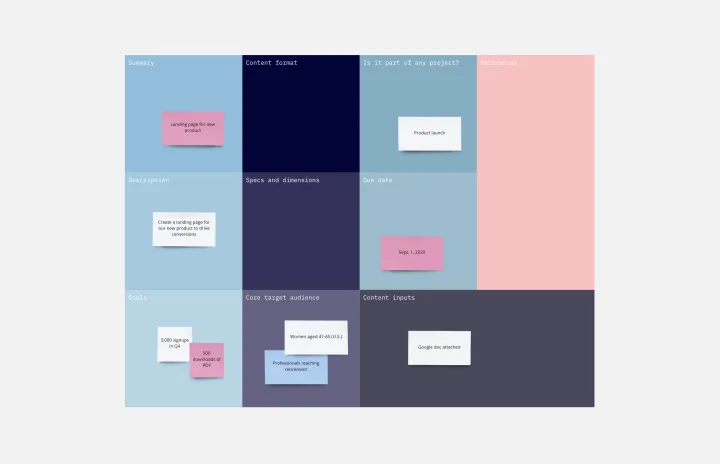
Even creative thinkers (or maybe especially creative thinkers) need clear guidelines to push their ideas in productive, usable directions. And a good creative lays down those guidelines, with information that includes target audience, goals, timeline, and budget, as well as the scope and specifications of the project itself. The foundation of any marketing or advertising campaign, a creative brief is the first step in building websites, videos, ads, banners, and much more. The brief is generally prepared before kicking off a project, and this template will make it easy.
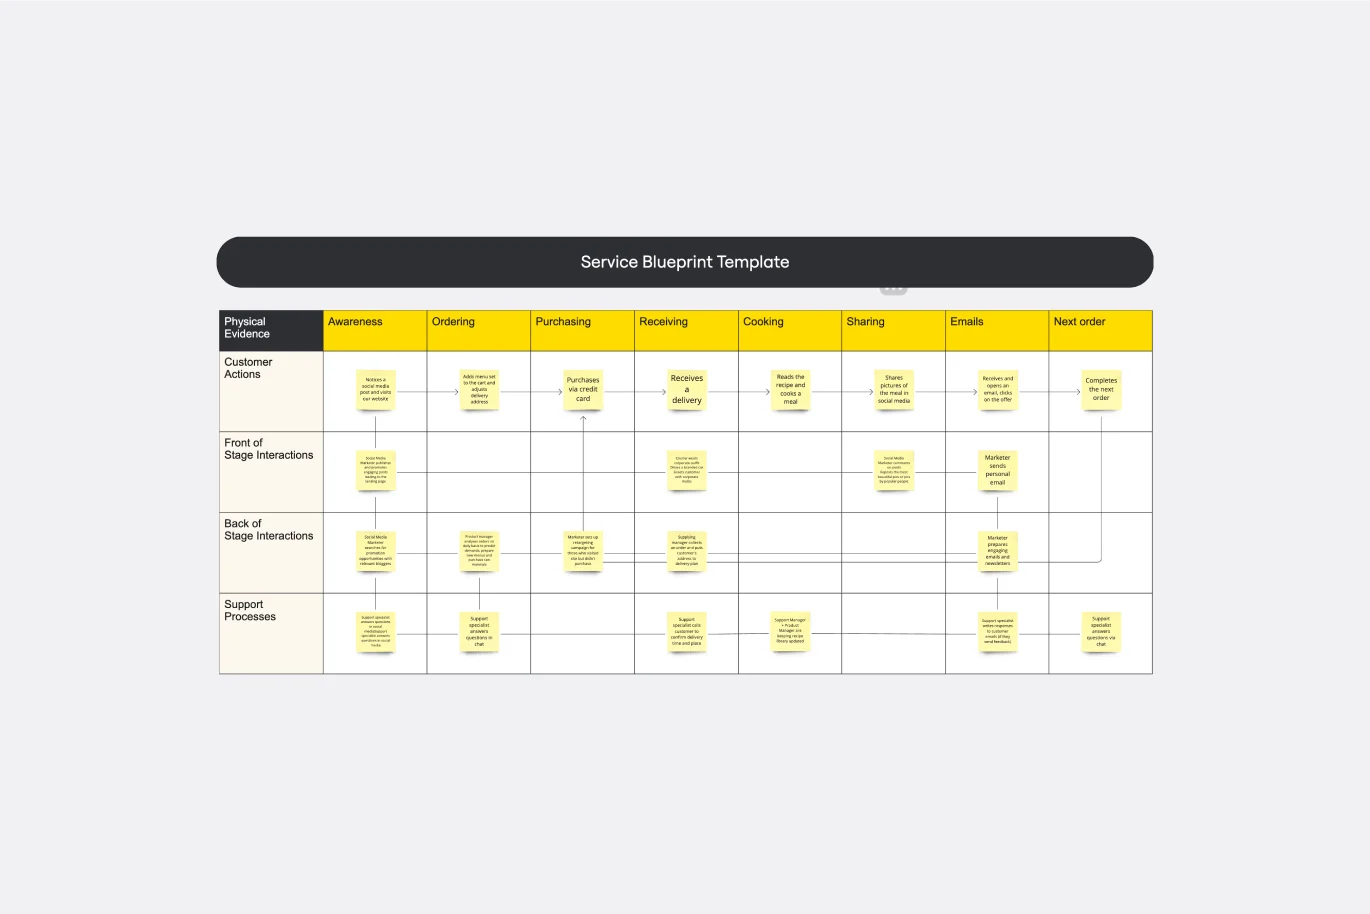
Service Blueprint Template
Works best for:
Desk Research, Operations, Market Research
First introduced by G. Lynn Shostack in 1984, service blueprints allow you to visualize the steps that go into a service process from the customer’s perspective. Service blueprints are useful tools for understanding and designing a service experience – and finding ways to improve it. Service blueprint diagrams make it simpler for teams to design new processes or improve existing ones. To create a service blueprint, map out each process and actor that contributes to the customer experience, from in-house contributors to third-party vendors.
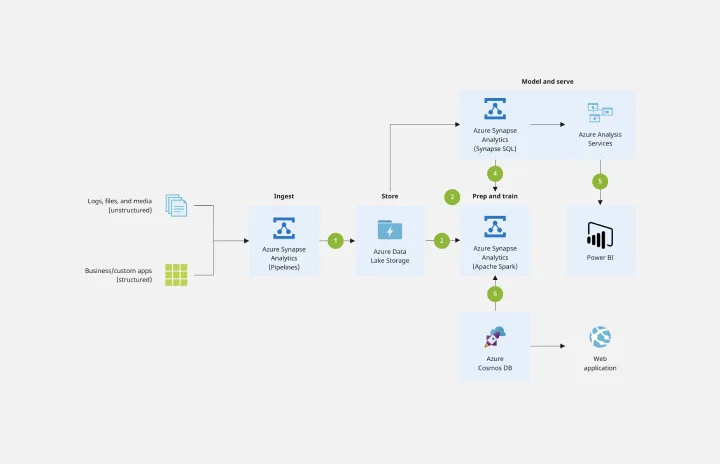
Azure Data Flow Template
Works best for:
Software Development, Diagrams
The Azure Data Flow is a diagram that will allow you to combine data and build and deploy custom machine learning models at scale. Azure is Microsoft’s cloud computing platform, designed to provide many cloud-based services like remote storage, database hosting, and centralized account management. Azure also offers new capabilities like AI and the Internet of Things (IoT).