Experience Mapping Template
Plan your product according to your customer’s needs and desires with the Experience Map Template. Bring a customer-centric approach to product development and branding.
Trusted by 65M+ users and leading companies


About the Experience Map Template
Josh Zak, a product strategist and Turtle Design co-founder, created this Experience Map Template to show clients how their customers interact with their brands. When prototyping or planning a product, this template helps you to uncover customer’s actions, feelings, and ways of thinking throughout their journey.
What’s the Experience Map Template?
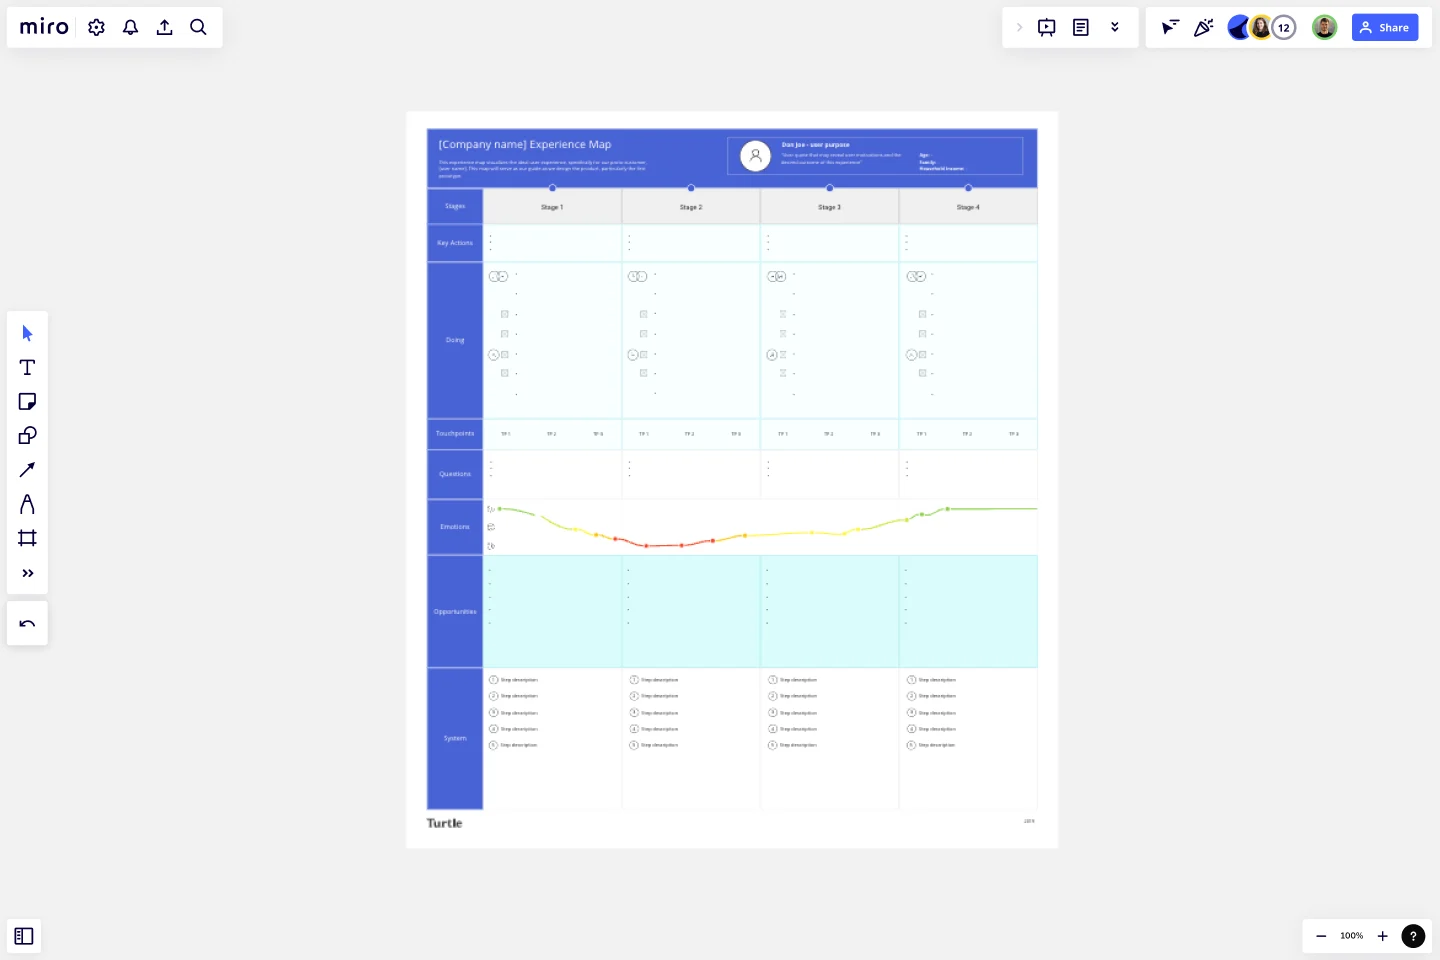
The Experience Map Template describes how your customer feels when in touch with your brand. The experience map comprises one frame detailing the customer journey, containing their key actions, feelings, and emotions. It also defines the customer journey stages, touchpoints, and opportunities when interacting with a brand or product.
Benefits of the Experience Map Template
Product managers, designers, and marketers can profit significantly from the experience map. When building a brand strategy, the customer experience map helps you to validate assumptions and guides your design and the strategy behind it.
Here are a few of the benefits of having an experience map:
Set stakeholder expectations
When building a product, design needs to be validated and assumptions tested. The Experience Map Template helps uncover your customer needs and pain points.
Find opportunities
The customer journey reveals the weaknesses and strengths of your product. Uncover opportunities to gain customers or to improve their existing experience when in touch with your brand.
Set the metrics for success
What does success look like? With the experience map, you can define success metrics bringing together business needs and customer satisfaction.
Discover critical points in your customer journey
Find the flaws in your strategy and prioritize what needs to be worked on.
How to use Experience Map Template?
Select the ready-made Experience Map Template and add it to your board. The experience map will guide your design and product decisions. Here are the main sections of the template:
User purpose: add a quote describing your ideal user and demographics.
Stages: Define the stages of your customer journey.
Key Actions: What do you want them to do at each customer journey stage?
Doing: Describe exactly what actions your ideal user performs at each stage.
Touchpoints: What are the customer touchpoints? Define each touchpoint according to customer journey stages.
Questions: Add any questions your user might have at each stage.
Emotions: How does your ideal user feel? Track their emotions at every stage.
Opportunities: Analyze their feelings and see the patterns. Identify what could be improved.
System: Which systems are used for every touchpoint? Describe in detail.
What is the difference between an experience map and a journey map?
The experience map is not tied to any product or service and often shows the generic user experience when in contact with a given brand or service. On the other hand, the customer journey is more specific, mapping out their journey when in touch with a particular feature, service, or product.
Get started with this template right now.
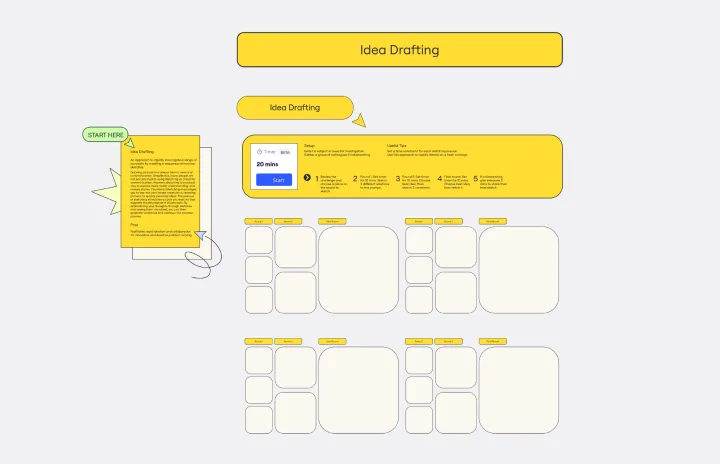
Idea Drafting Template
The Idea Drafting Template encourages you to tap into your innate creativity by drawing pictures to quickly generate ideas. The sketching process stimulates a cycle of creativity that supports the development of concepts. By externalizing your thoughts through sketches and seeing them visualized, you can generate variations and continue the creative process.
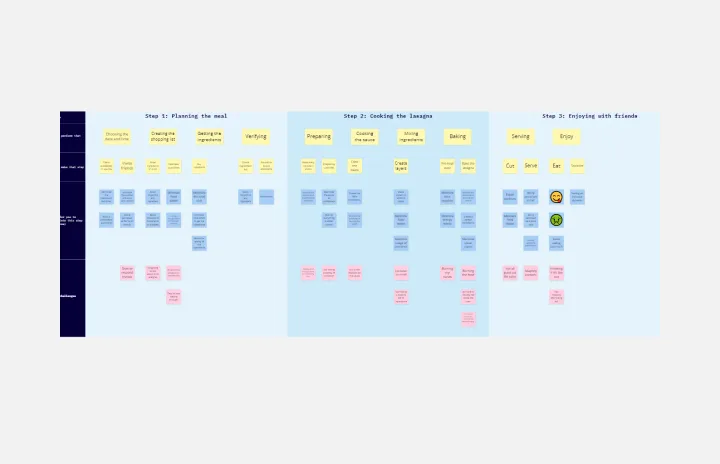
Job Map Template
Works best for:
Design, Desk Research, Mapping
Want to truly understand your consumers’ mindset? Take a look at things from their perspective — by identifying the “jobs” they need to accomplish and exploring what would make them “hire” or “fire” a product or service like yours. Ideal for UX researchers, job mapping is a staged process that gives you that POV by breaking the “jobs” down step by step, so you can ultimately offer something unique, useful, and different from your competitors. This template makes it easy to create a detailed, comprehensive job map.
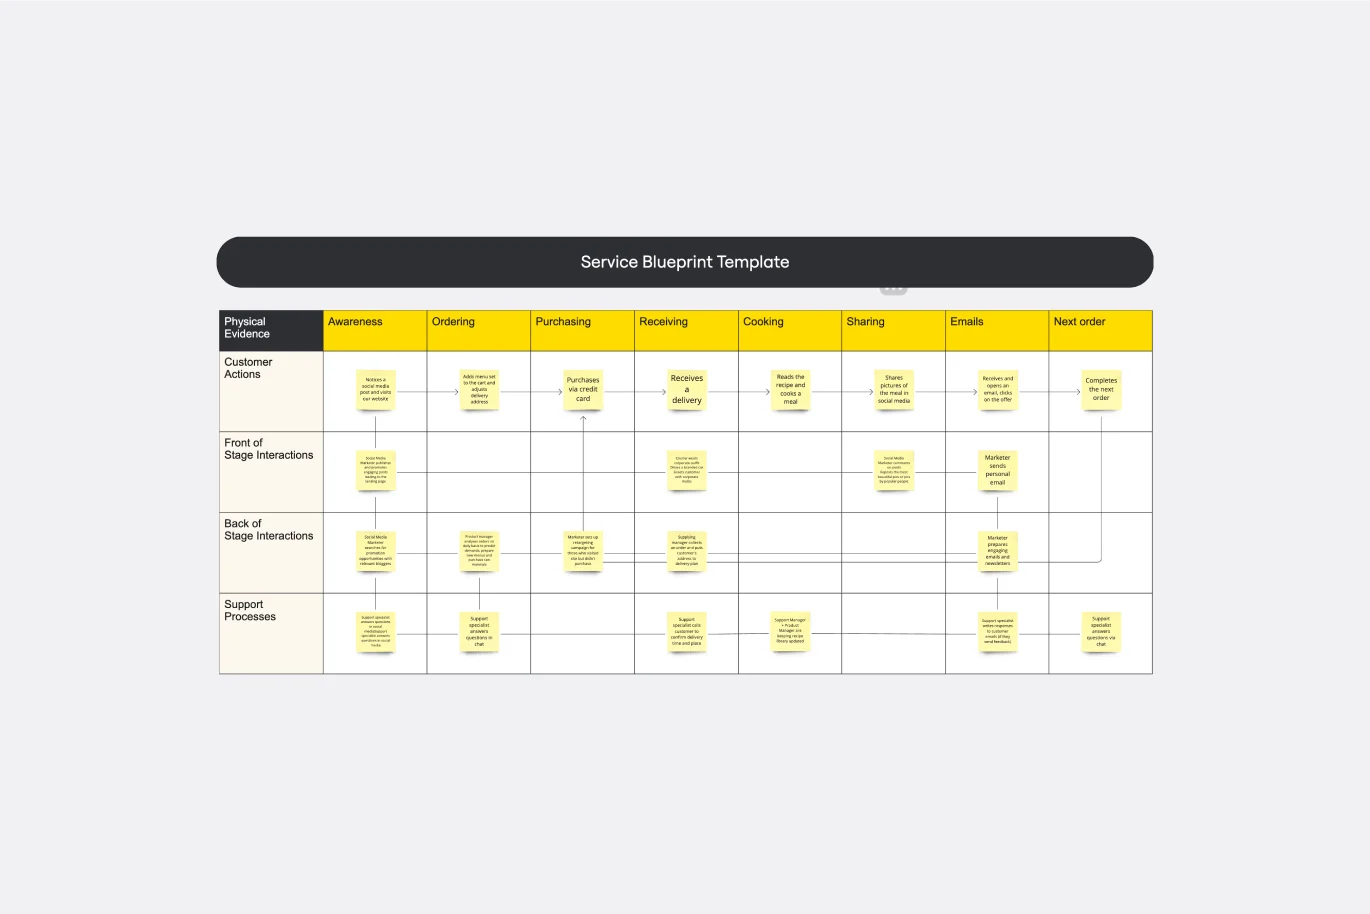
Service Blueprint Template
Works best for:
Desk Research, Operations, Market Research
First introduced by G. Lynn Shostack in 1984, service blueprints allow you to visualize the steps that go into a service process from the customer’s perspective. Service blueprints are useful tools for understanding and designing a service experience – and finding ways to improve it. Service blueprint diagrams make it simpler for teams to design new processes or improve existing ones. To create a service blueprint, map out each process and actor that contributes to the customer experience, from in-house contributors to third-party vendors.
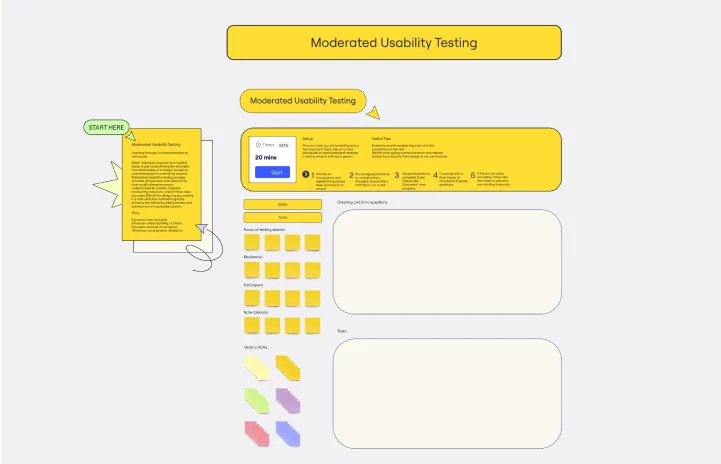
Moderated Usability Testing Template
Works best for:
Design
Encouraging individuals to express their implicit ideas helps identify the strengths and weaknesses of a design, and Moderated Usability Testing Template provides valuable perspectives. Typically, conducting only six to nine of these tests uncovers 80% of design issues, making it a cost-effective method to enhance potential solutions.
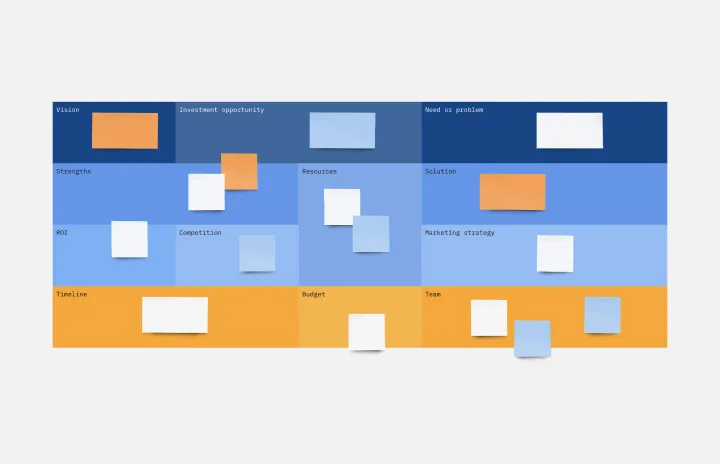
Executive Summary Template
Works best for:
Leadership, Project Management, Documentation
Pique their curiosity. Get them excited. Inspire them to keep reading, diving further into your proposal details. That’s what a good executive summary has the power to do—and why it’s a crucial opening statement for business plans, project plans, investment proposals, and more. Use this template to create an executive summary that starts building belief, by answering high-level questions that include: What is your project? What are the goals? How will you bring your skills and resources to the project? And who can expect to benefit?
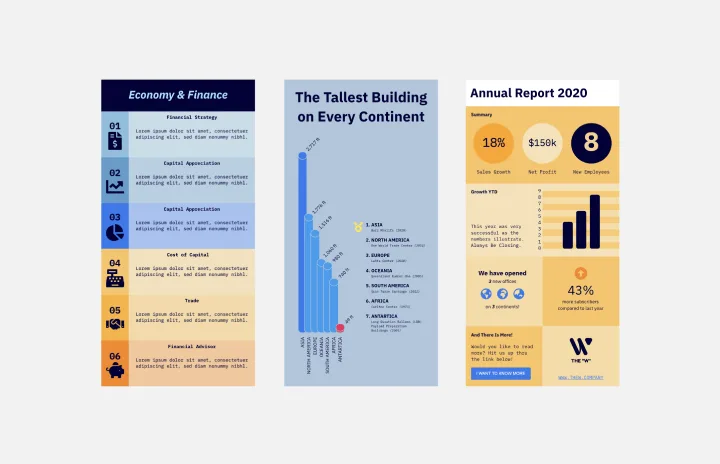
Infographic Template
Works best for:
Marketing, Desk Research, Documentation
As we bet you’ve experienced, data can get pretty dense and dry. But you need it to be compelling, memorable, and understandable. The solution? Infographics. These are tools that let you present information in a visually striking way and turn quantitative or qualitative data into stories that engage and resonate. Whoever you’ll be presenting to — customers, donors, or your own internal teams — our template will let you design an infographic that combines text and visuals to break down even the most complicated data.