Cladogram Template
Easily explain evolutionary relationships with the Cladogram Template.
Trusted by 65M+ users and leading companies


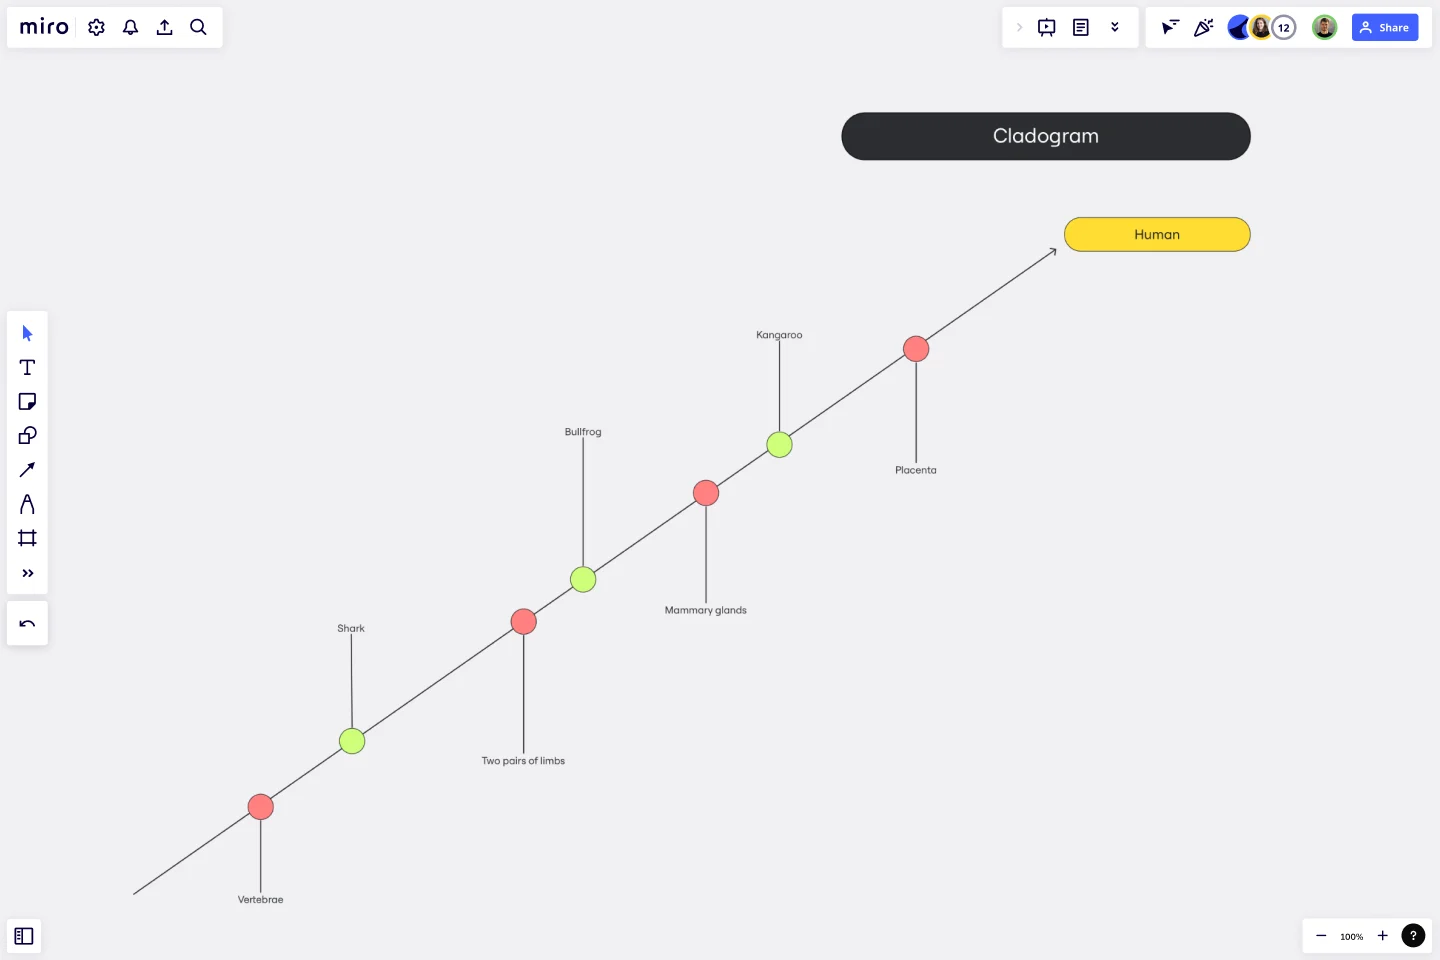
About the Cladogram Template
The Cladogram Template is a helpful visual tool that simplifies the representation of evolutionary relationships among different species or concepts. A cladogram is a branching diagram that displays the connections between various entities based on shared characteristics and evolutionary divergence.
The template enables users to easily create, edit, and expand cladograms. It's a powerful asset for educators, scientists, and professionals who want to simplify complex relationships and showcase evolutionary connections.
How to use the cladogram template in Miro
Customize easily: Edit the template with just a few clicks, tailoring it to your specific requirements. Change labels, change branches, and adjust the structure effortlessly.
Automated diagramming: Leverage Miro's automated diagramming features to expand your cladogram. The platform intelligently adjusts the layout as you add or remove elements, ensuring a visually appealing and logically structured diagram.
Add context: Enhance your cladogram by incorporating artifacts from your Miro board. This could include images, text, or other relevant materials, providing additional context and depth to your evolutionary representation.
Why use a cladogram template?
Simplify complex concepts: Simplify intricate evolutionary relationships and present them in a clear and comprehensible format.
Enhance collaboration: Facilitate team collaboration by visualizing a shared understanding of evolutionary connections.
Save time: Use the template's user-friendly design and automation features, which allow you to focus on content rather than formatting.
Dynamic adaptability: Adapt your cladogram quickly as new information arises or concepts evolve, ensuring that your diagrams remain relevant.
Effective communication: Communicate complex ideas effectively, whether in the classroom, research setting, or professional environment.
Find out all the features of Miro's cladogram maker and start building your diagram right now.
Can I customize the colors and shapes of elements in the cladogram?
Miro's cladogram template allows complete customization, including colors, shapes, and labels, empowering you to create visually appealing and informative diagrams.
Can I export the cladogram created in Miro to other file formats?
Yes, Miro supports various export formats, ensuring that your cladogram can be shared in multiple ways, such as PDFs or images.
Get started with this template right now.
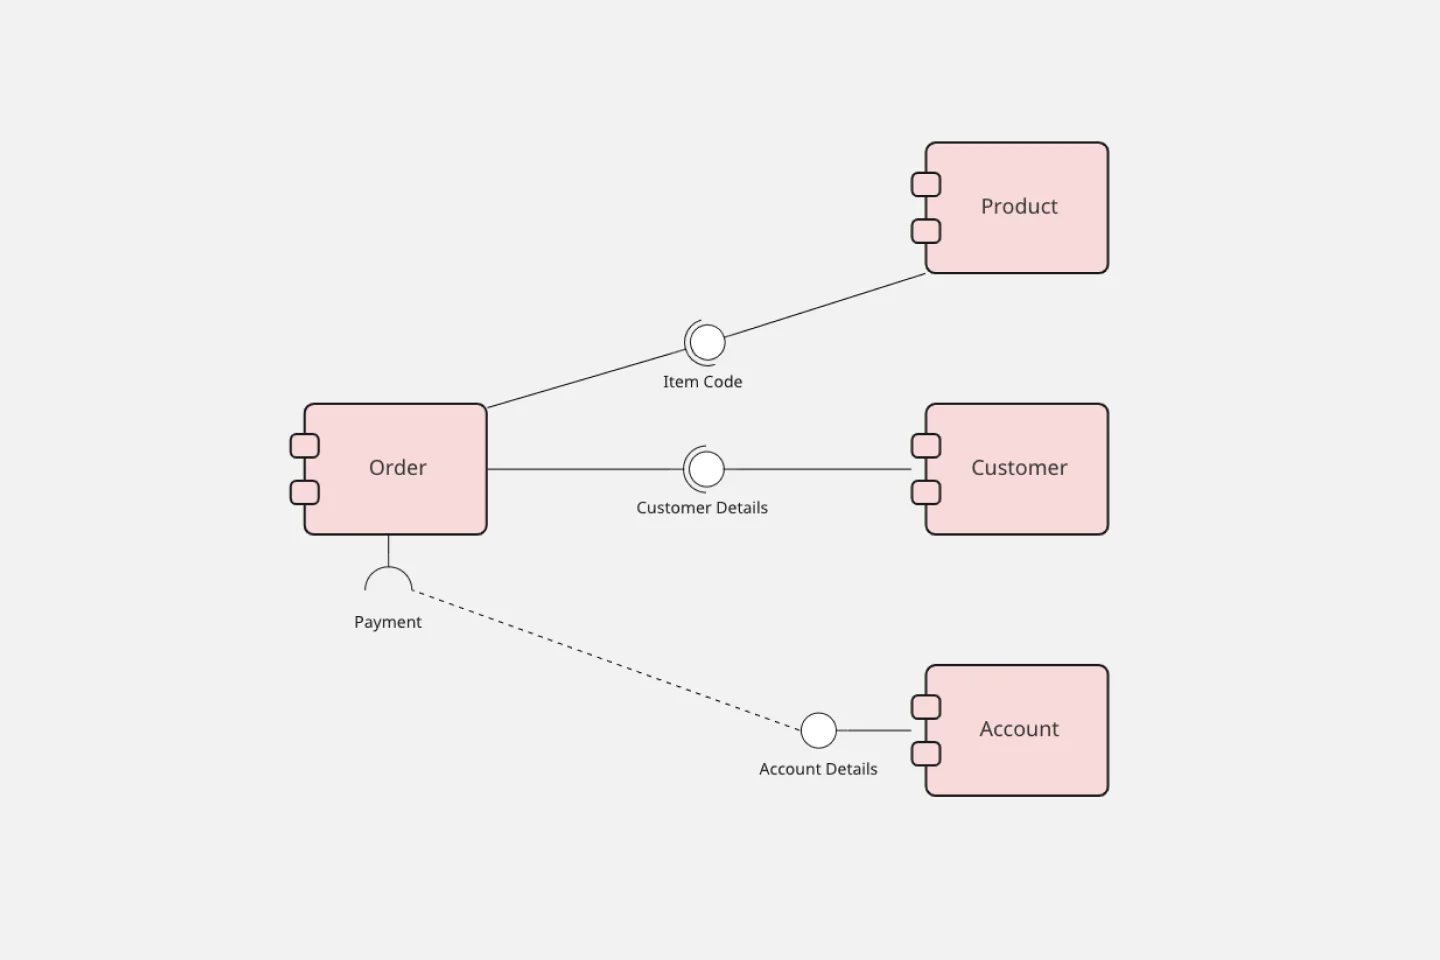
UML Component Diagram Template
Works best for:
Mapping, Diagrams, Software Development
Use our Component Diagram template to show how a system’s physical components are organized and wired together. Visualize implementation details, make sure planned development matches system needs, and more — all in a collaborative environment.

Opportunity Solution Tree Template
Works best for:
Flowcharts, Product Management, Diagrams
Solving problems — successful companies and productive teams just know how to do it. They’re able to identify many possible solutions, then settle on the one that leads to the desired outcome. That’s the power an Opportunity Solution Tree gives you. Designed by Teresa Torres, a product discovery coach, this mind map breaks down your desired outcome into opportunities for the product to meet user needs, then gives your team an effective way to brainstorm potential solutions.
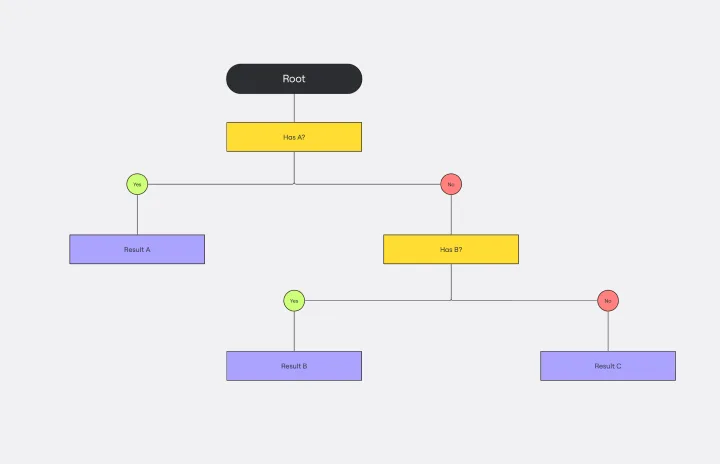
Dichotomous Key Template
Works best for:
Diagramming
The Dichotomous Key Template stands out as an exceptional tool for simplifying complex classification processes, significantly enhancing learning experiences. Breaking down intricate subjects into a series of binary decisions transforms how information is absorbed and understood. This systematic approach not only aids in retaining intricate details but also makes the learning process more engaging and interactive. Whether for educational purposes or professional use, the template’s design fosters a deeper comprehension of the subject matter, allowing learners and professionals to navigate complex scenarios with clarity and ease.
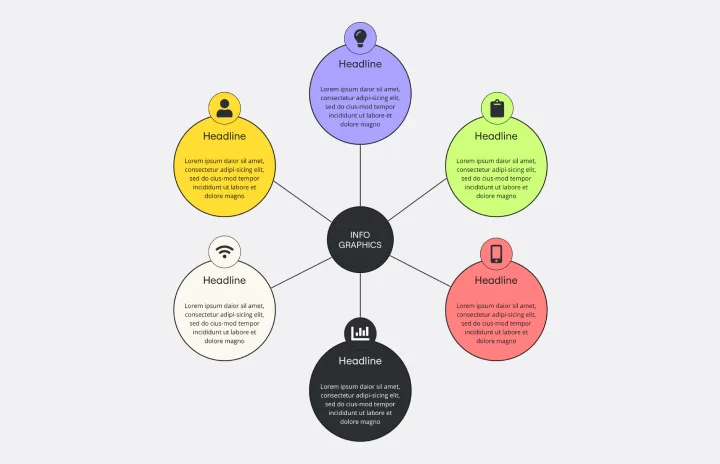
Web Diagram Template
Miro's Web Diagram Template simplifies complex project organization and promotes effective communication. It allows users to easily connect elements and gain a comprehensive understanding of complex relationships, making it a versatile and invaluable asset for diverse projects.
Fishbone Diagram Template
Works best for:
Operations, Diagrams, Workflows
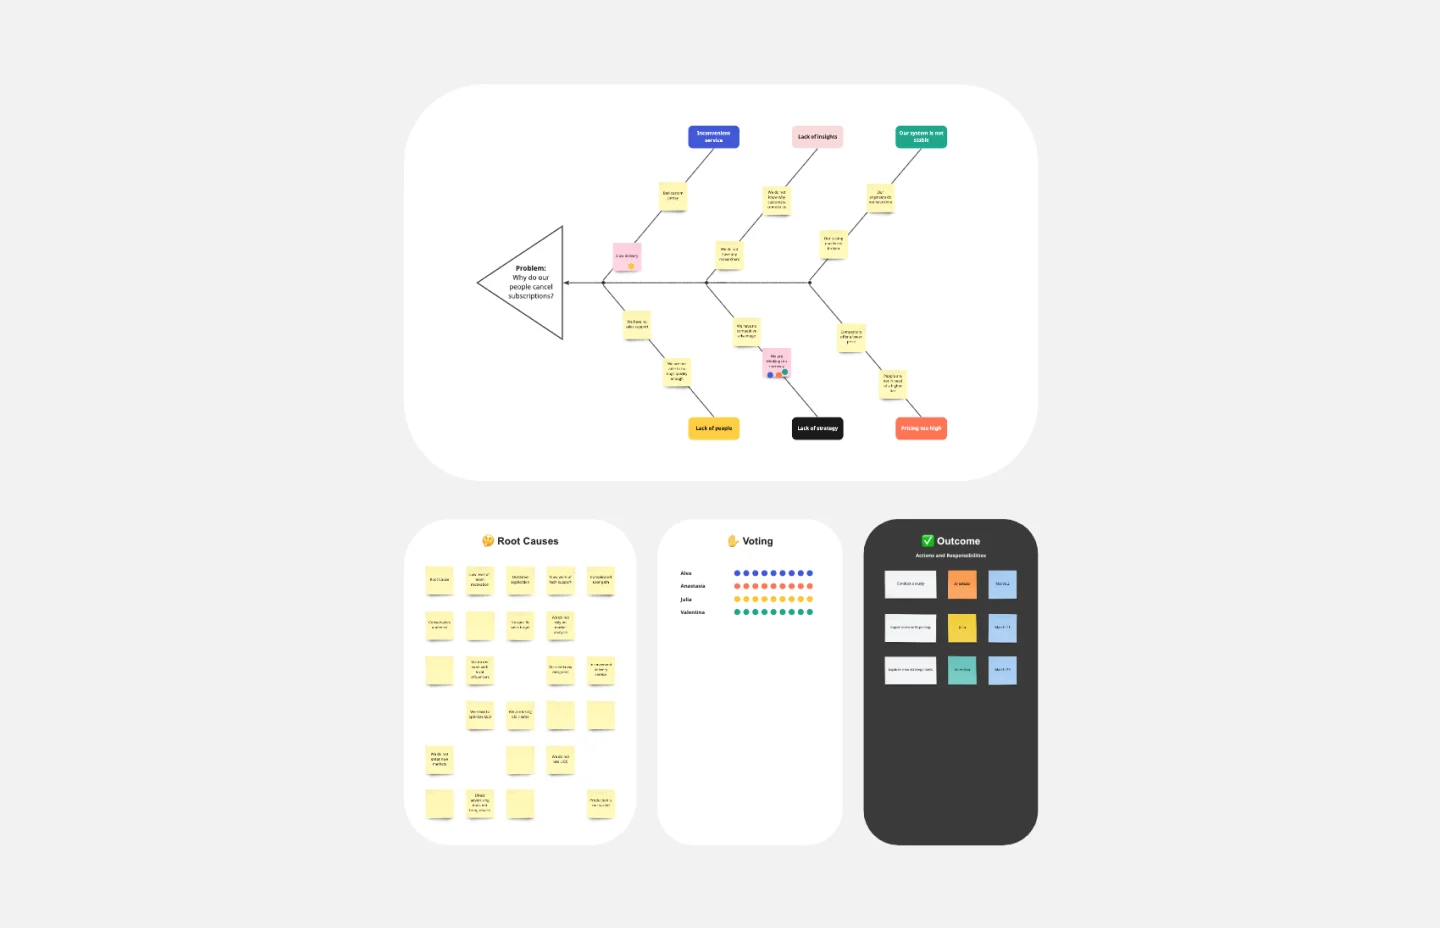
What is the best way to solve any problem your team faces? Go straight to the root. That means identifying the root causes of the problem, and fishbone diagrams are designed to help you do it best. Also known as the Ishikawa Diagram (named after Japanese quality control expert Kaoru Ishikawa), fishbone diagrams allow teams to visualize all possible causes of a problem, to explore and understand how they fit together holistically. Teams can also use fishbone diagrams as a starting point for thinking about what the root cause of a future problem might be.
Objectives and Key Results (OKRs) Template
Works best for:
Leadership, Strategic Planning, Project Planning
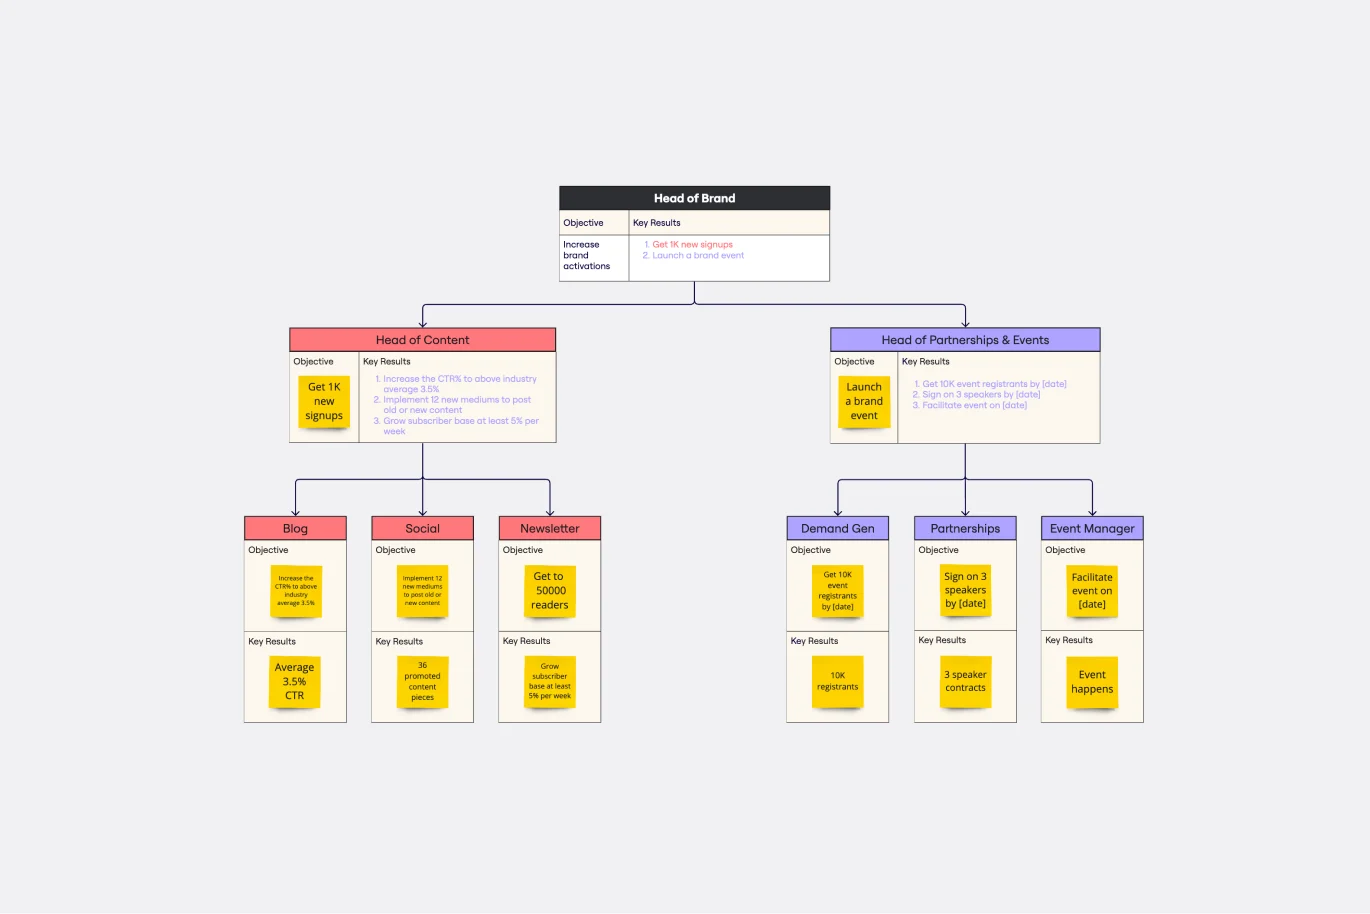
Clarity, focus, and structure — those are the key ingredients to feeling confident in your company’s directions and decisions, and an OKR framework is designed to give them to you. Working on two main levels — strategic and operational — OKRs (short for objectives and key results) help an organization’s leaders determine the strategic objectives and define quarterly key results, which are then connected to initiatives. That’s how OKRs empower teams to focus on solving the most pressing organizational problems they face.