Cause and Effect Diagram Template
Quickly analyze relationships and identify the root causes within a system with the cause and effect diagram template.
Trusted by 65M+ users and leading companies


About the Cause and Effect Diagram Template
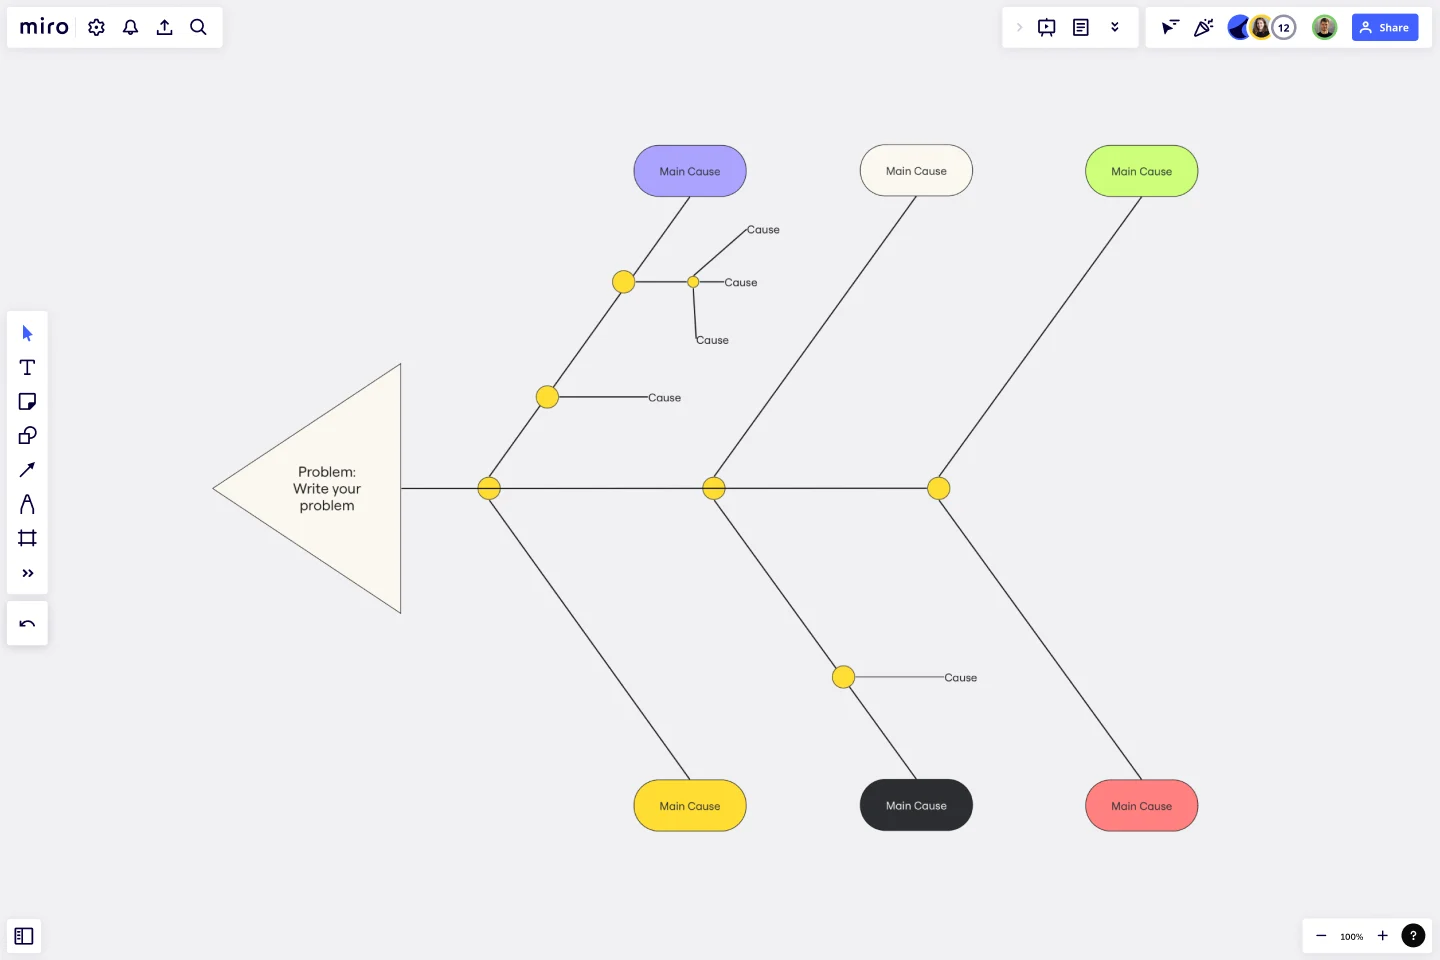
The cause-and-effect diagram template is an effective tool for analyzing complex relationships and identifying the root causes within a system. This template is a more straightforward version of the Fishbone or Ishikawa diagram. It is used to visually represent the cause-and-effect relationships in a structured manner. Whether you are solving problems, improving a process, or troubleshooting, this template provides a systematic approach to identifying and understanding the factors influencing a specific issue.
Understanding the cause and effect diagram template
The cause and effect diagram template categorizes potential causes into branches. Here is how the template is built:
Problem statement: Clearly defines the identified issue as the central focal point for exploring potential causes.
Categories of causes: Organizes potential causes into branches, offering a systematic and categorized approach to analysis.
Main bones: Represents primary categories of causes as main branches extending from the spine of the fishbone diagram.
Sub-branches: Break down each main branch into sub-branches, thoroughly exploring potential causes.
Analysis section: Dedicates space for in-depth analysis, enabling teams to fully explore each cause's impact on the identified problem.
How to use the cause and effect diagram template
Edit with precision: You can customize the template easily by using drag-and-drop functionality. This will help you address your specific problem and its potential causes.
Collaborative analysis: You can engage in real-time collaboration with your team members directly on the Miro board. This will foster collective analysis and brainstorming sessions.
Root cause identification: You can use the template to systematically identify root causes. This will help you gain a thorough understanding of the problem and enable you to solve it effectively.
Why should you use a cause-and-effect diagram template?
Structured problem analysis: Organize and analyze potential causes systematically, providing a structured framework for identifying the root cause of a problem.
Team collaboration: Facilitate collaborative problem-solving sessions, ensuring diverse perspectives contribute to a comprehensive analysis.
Visual clarity: Enhance understanding through visual representation, facilitating comprehension of complex cause-and-effect relationships.
Strategic decision-making: Equip teams with insights to make informed and strategic decisions based on a thorough understanding of the problem's causes.
Process improvement: Drive continuous improvement by systematically addressing root causes enhancing efficiency and effectiveness within processes.
Is there a recommended order for exploring the causes in the template?
While there is no strict order, initiating analysis with main branches and progressively exploring sub-branches for a thorough and structured examination is often beneficial.
Can I export or share the Cause and Effect Diagram created in Miro with stakeholders outside the platform?
Miro offers export and sharing features, allowing users to share the diagram with stakeholders outside the platform for review and collaboration.
Get started with this template right now.
Project Organizational Chart Template
Works best for:
Project Management, Documentation, Org Charts
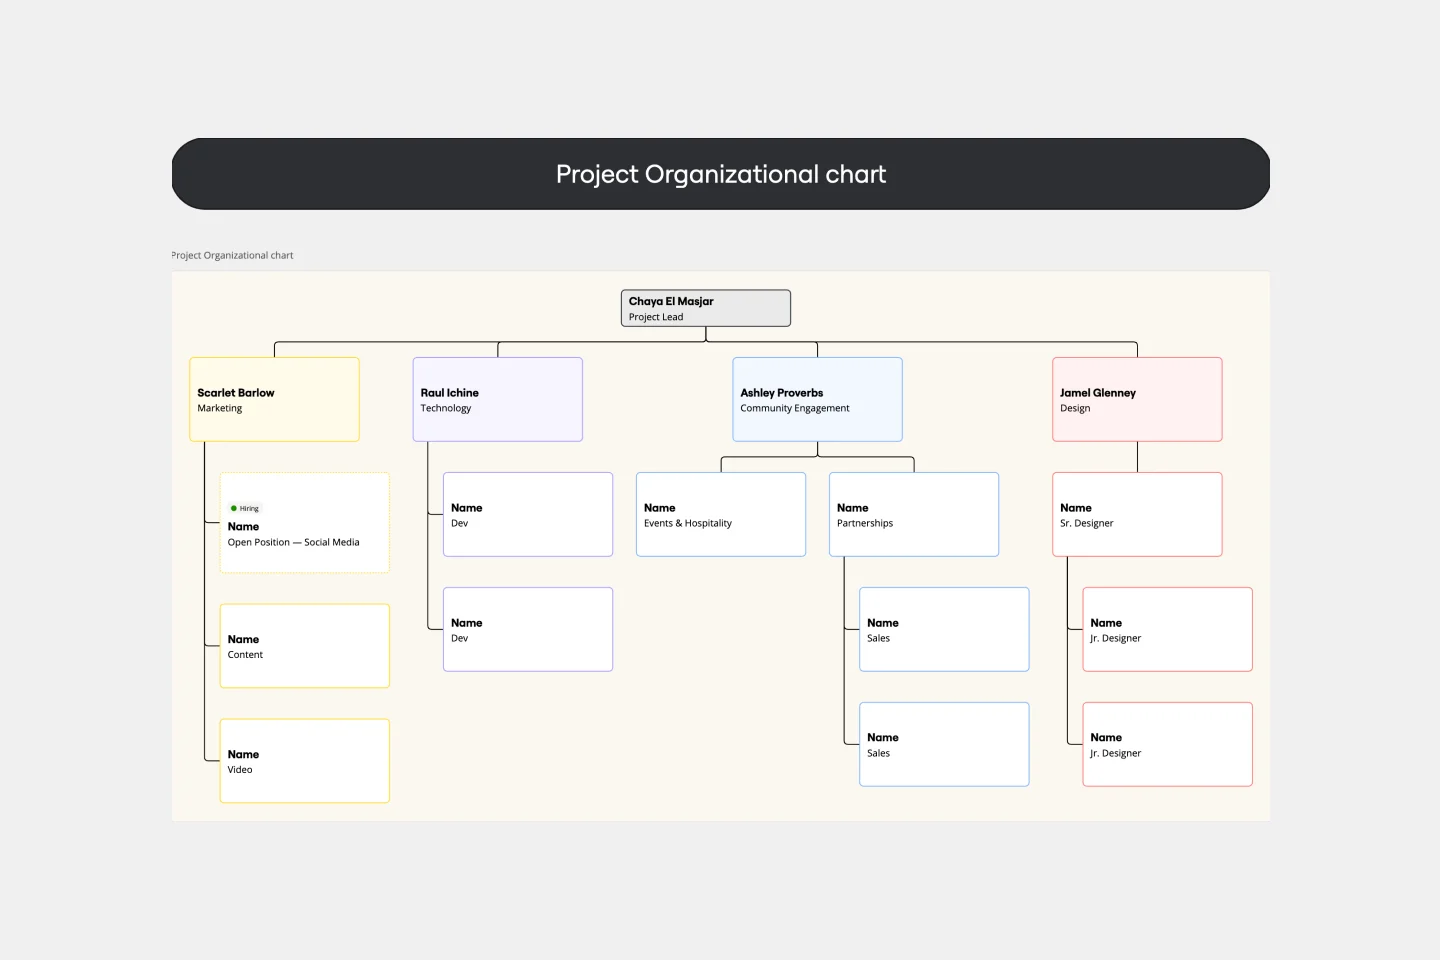
When you’re embarking on a long, complex project, you will inevitably hit roadblocks and obstacles. It’s important to have your project organizational chart on hand to overcome those challenges. A project organizational chart is a visual diagram that illustrates who is on your team and the role they play in a given project. It documents the structure of the project organization, the hierarchy between team members, and the relationships between employees. Project organizational charts are useful tools for clarifying who does what, securing buy-in, and setting expectations for the group.

Azure Demand Forecasting Template
Works best for:
Software Development, Diagrams
The Azure Demand Forecasting diagram will show the architecture of a demand forecast, making it easier for you to predict data consumption, costs, and forecast results. Azure is Microsoft’s cloud computing platform, designed to provide cloud-based services such as remote storage, database hosting, and centralized account management. Azure also offers new capabilities like AI and the Internet of Things (IoT).
Pedigree Diagram Template
Works best for:
Diagrams, Education
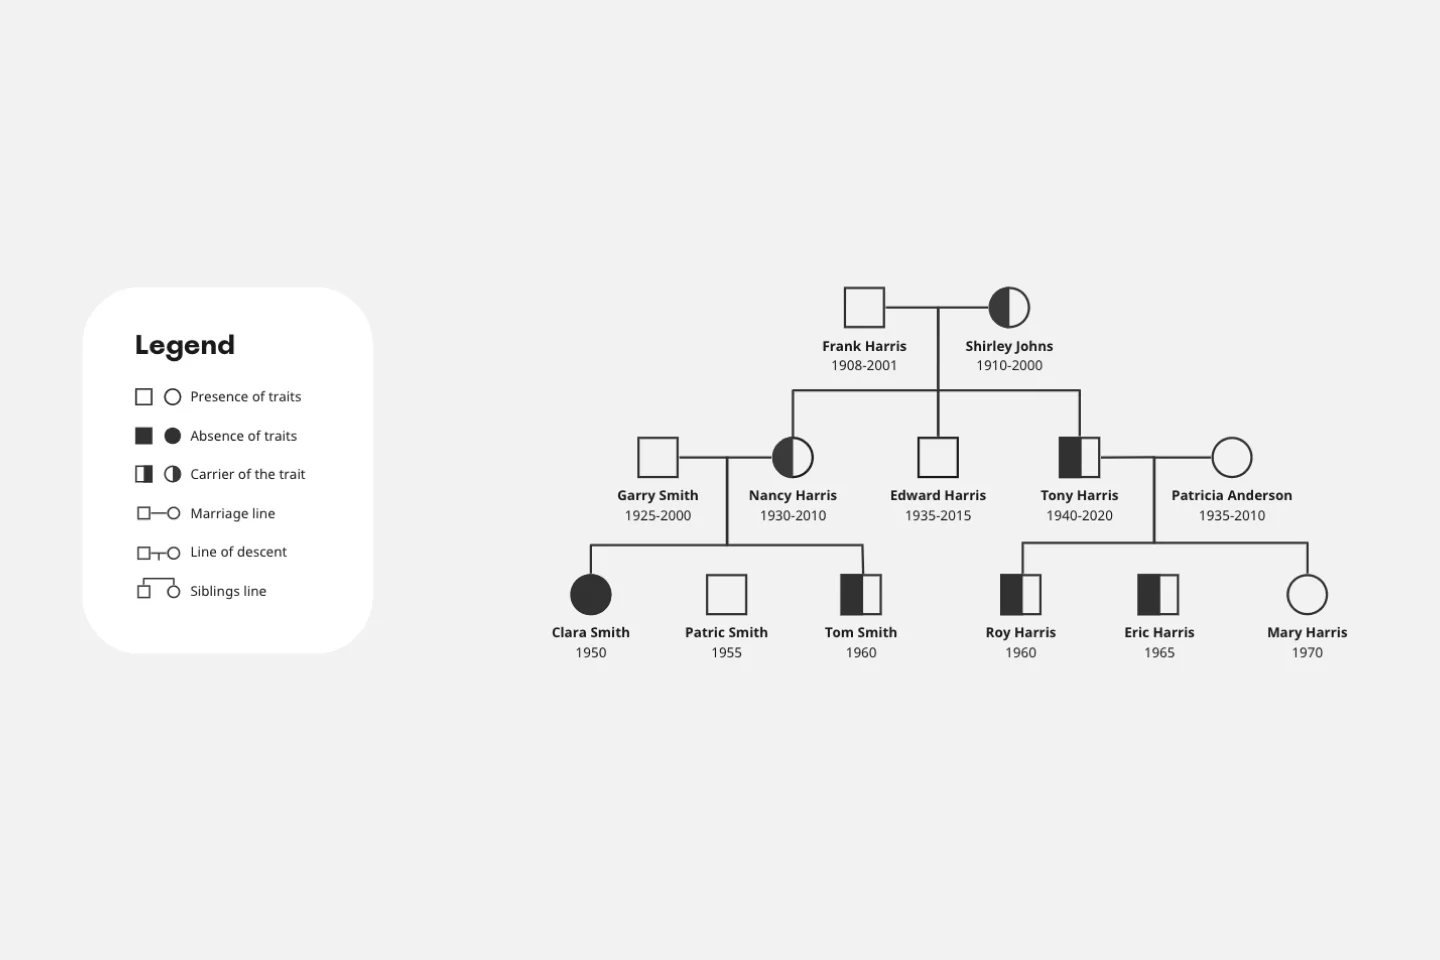
Use our Pedigree Diagram Template to show how traits and diseases are passed from one generation to the next. Whether you’re a doctor, farmer, or just someone interested in genetics, a Pedigree Diagram can help you identify hereditary traits.
SAFe Program Template
Works best for:
Agile Methodology, Diagrams, Agile Workflows
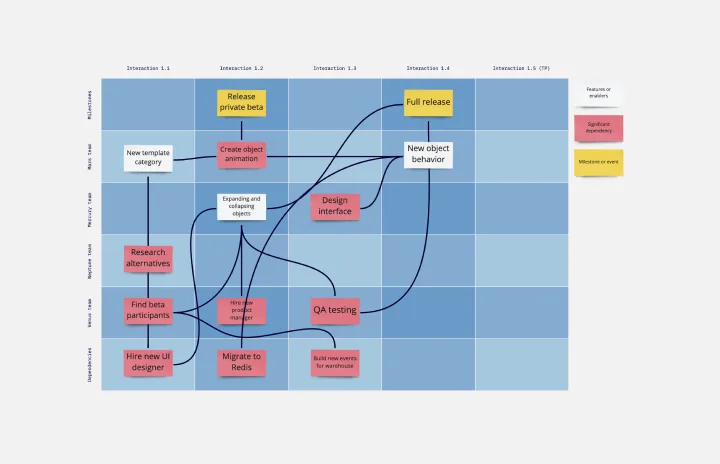
Many organizations use the Agile model, but even companies that don’t rigorously adhere to all Agile standards have adopted Agile tools and methods like Program Increment (PI) Planning. Even if you’re not participating in a formal PI session, a program board can be a great way to establish communication across teams and stakeholders, align development objectives with business goals, clarify dependencies, and foster cross-functional collaboration. The board provides much-needed structure to planning sessions, yet is adaptable enough to accommodate brainstorming and alignment meetings.

Login Sequence Diagram Template
Works best for:
Diagramming, Technical Diagramming
The UML Sequence Login Diagram Template is a valuable tool for visualizing user authentication processes. It breaks down complex login sequences into clear, visual components, facilitating collaborative understanding among team members, regardless of their technical expertise. This shared understanding is crucial for ensuring all stakeholders, from developers to project managers, are on the same page, leading to efficient decision-making and a smoother development process. The template's ability to translate technical details into an accessible format streamlines communication and significantly reduces the likelihood of misinterpretation or oversight, making it an essential asset in any software development project.

Stage-Gate Process Flowchart Template
Works best for:
Diagramming, Project Management
The Stage-Gate Process Flowchart Template structures a project into distinct stages separated by decision-making gates, enhancing the quality of decisions and leading to more successful project outcomes.