BCG Matrix Template
Analyze ways to spur business growth and capture market share with the BCG matrix template.
Trusted by 65M+ users and leading companies


About the BCG Matrix Template
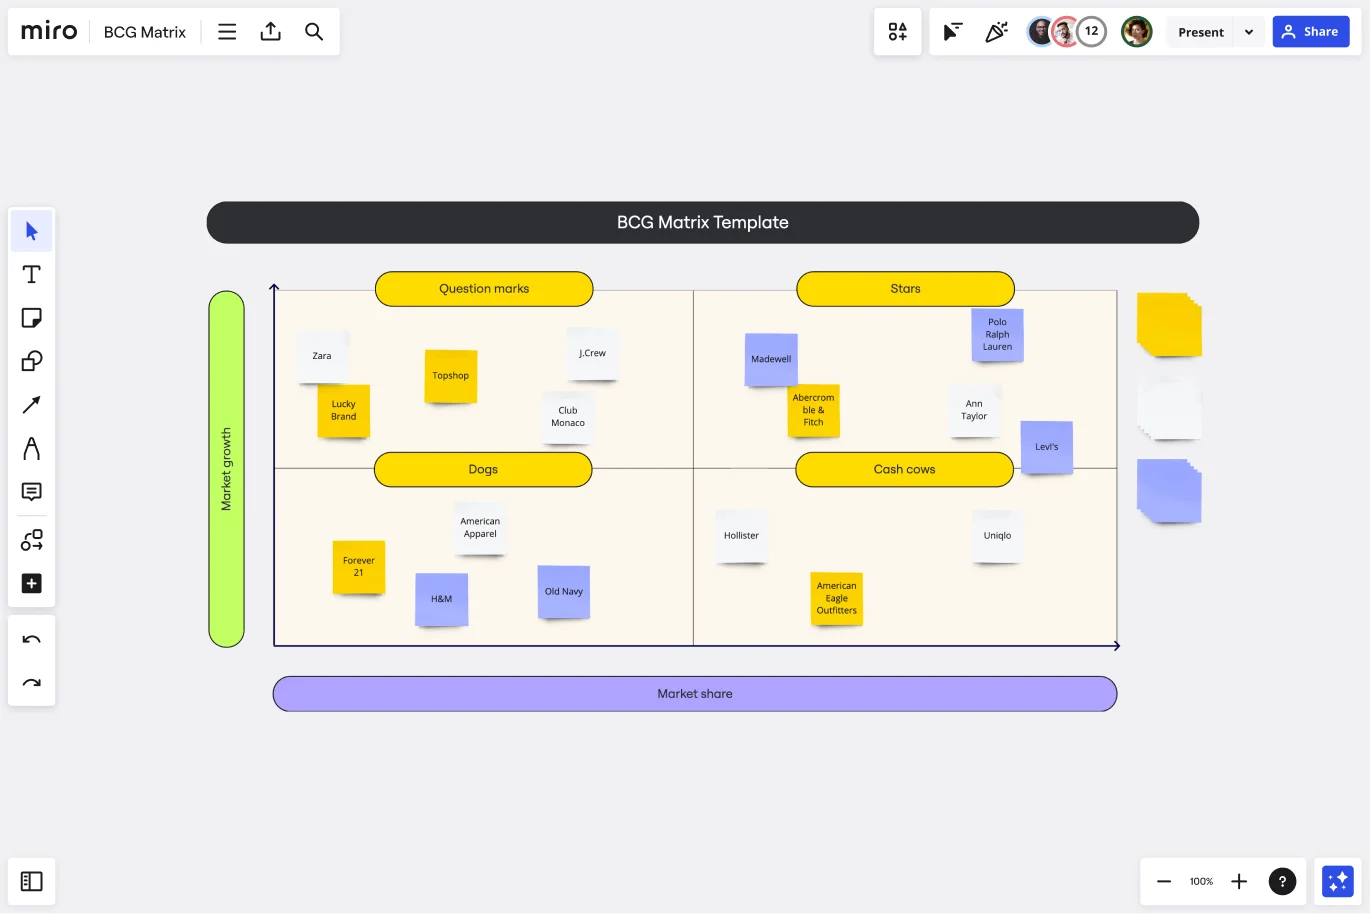
The BCG matrix template is a four-quadrant grid that allows businesses to visualize where and how they can grow their market share. Businesses can use this template to see where they currently stand in the marketplace. In doing this, they can also identify the best areas for growth.
What is a BCG matrix?
Created by the Boston Consulting Group, the BCG matrix (also known as the Boston matrix or growth-share matrix) is a strategic planning tool. The BCG matrix divides business units and products into one of four categories based on their market shares. With this information, businesses get an insight into which products can help them capitalize on market share growth opportunities.
What are the two measurements used in the BCG matrix?
There are two key measurements used in the BCG matrix: analyzing the market growth rate and reviewing relative market share.
Market growth rate: This measurement looks at the level of revenue growth within the marketplace. It usually compares growth with the previous year to predict future growth.
Relative market share: This measurement analyzes your current position in the marketplace in relation to your largest competitor.
Reviewing these measurements allows you to identify likely opportunities for growth. It also helps you find any problem areas or areas of improvement in your existing products.
4 elements of a BCG matrix template
If you’re working with a product portfolio, a BCG growth-share matrix can give you a quick overview of how products are performing and help you build a basis for further analysis. To use the chart, analysts plot a scatter graph to rank business units (or products) according to their relative market shares and growth rates.
1. Cash cows
These are products or business units with a high market share in a slow-growing industry. These units typically generate cash above the amount needed to maintain the business.
2. Dogs
Dogs are units with a low market share in a mature, low-growth industry. These units typically "break even," generating barely enough cash to maintain the business's market share. Many investors choose to sell off dogs.
3. Question marks
Also called “problem children,” question marks operate in a high-growth market yet maintain a low market share. They could potentially gain market share, become stars, and then become cash cows. Question marks should be analyzed carefully to determine whether they are worth the investment required to grow market share.
4. Stars
Stars are units with a high market share in a fast-growing industry. They have graduated from question marks with a market- or niche-leading trajectory.
How do you use a BCG matrix template?
Miro is the perfect tool to create and share your BCG matrix. Get started by selecting this BCG matrix template. The simple template allows you to collaborate on portfolio analysis in real-time and takes only a minute to set up. A completed matrix can be used to assess the strength of your organization and its product portfolio.
To give you an idea of how to create your own BCG matrix using our template, we’ve outlined a simple step-by-step guide.
Step 1: Choose the product. Start by identifying the product or services you want to analyze with the matrix.
Step 2: Define the market. To use the BCG matrix template effectively, you must define your market correctly. If you don’t, the results from the matrix won’t be accurate. To ensure you’ve got a good handle on the market you need to review, we suggest doing a market analysis.
The process involves performing a quantitative and qualitative assessment of the market. It looks at the size of the market, the target audience, the competition, and the economic environment.
Step 3: Calculate the relative market share. Find out how you currently stand by calculating your relative market share. Here’s the formula you need:
Relative market share = your market share / your largest competitor’s market share.
Step 4: Find out the market growth rate. Figure out how much the marketplace has grown over the last year using this formula:
Market growth rate = total sales in current year / total sales from previous year.
Step 5: Add all the information to the matrix. You’ve done the legwork — now it’s time to put all the information in the matrix template. Then, you can use Miro’s easy collaboration features to share it with your team, stakeholders, and anyone else who would benefit from seeing it.
Examples of when to use a BCG matrix
Your organization can find a BCG matrix useful in several areas: marketing, project management, and strategic management. Typically, the matrix is used during the strategic planning phase of a marketing plan or project. It can also be used for business portfolio analysis.
Let’s take a look at some examples:
1. To increase investment in a product to capture additional market share. If one of your products sits in the question mark category, you know that investing in this product is likely to get an increase in market share.
2. To determine whether you should pause investment in a certain product. If a product sits in the dog category, you know that you’re not likely to see a lot of growth. If you’re looking to pause investment, products in this section would be your best bet.
3. To maximize cash flow from a product. Using the matrix, you can see which products are your top performers, otherwise known as star products. These are the big sellers with the most market share, so you can use the matrix to identify which products yield the highest revenue.
4. To best allocate resources. The matrix shows you which products are worth investing time, money, and resources in so that you have the best chances of turning a profit. For businesses operating in a competitive landscape, this is incredibly helpful.
Typically speaking, the matrix is better suited for large businesses. In smaller businesses, relative market share can be too small to quantify. It’s also based on the idea that market share can be achieved by spending more on the marketing budget. If you have a limited budget, you might be restricted in how you can use the BCG matrix.
If you’re a small business, we’d suggest using a SWOT analysis instead.
What are the four quadrants of the BCG matrix?
The four quadrants of a BCG matrix are cash cows (high market share, slow growth), dogs (low market share, low growth), question marks (high market share, low growth), and stars (high market share, high growth).
How do you use the BCG matrix model?
The BCG matrix model is used to assess the quality of investments in a business portfolio and their potential for future profitability. A BCG matrix is useful because it assesses the external environment and is best paired with other forms of internal analysis that assess the quality and state of the investments themselves.
Get started with this template right now.
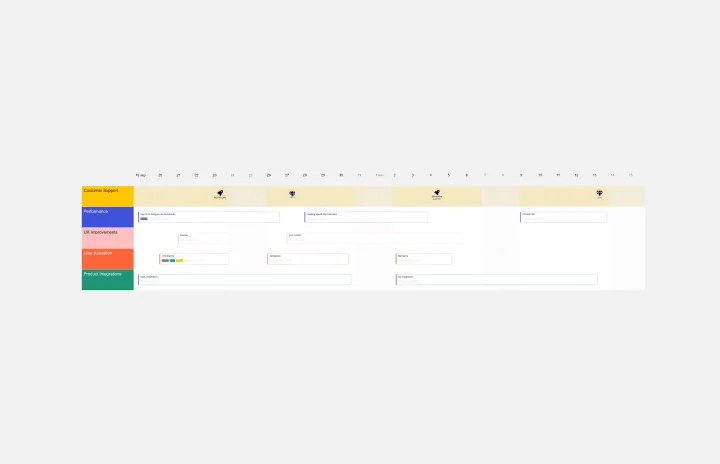
Product Development Roadmap Template
Works best for:
Product Management, Software Development, Roadmaps
Product development roadmaps cover everything your team needs to achieve when delivering a product from concept to market launch. Your product development roadmap is also a team alignment tool that offers guidance and leadership to help your team focus on balancing product innovation and meeting your customer’s needs. Investing time in creating a roadmap focused on your product development phases helps your team communicate a vision to business leaders, designers, developers, project managers, marketers, and anyone else who influences meeting team goals.
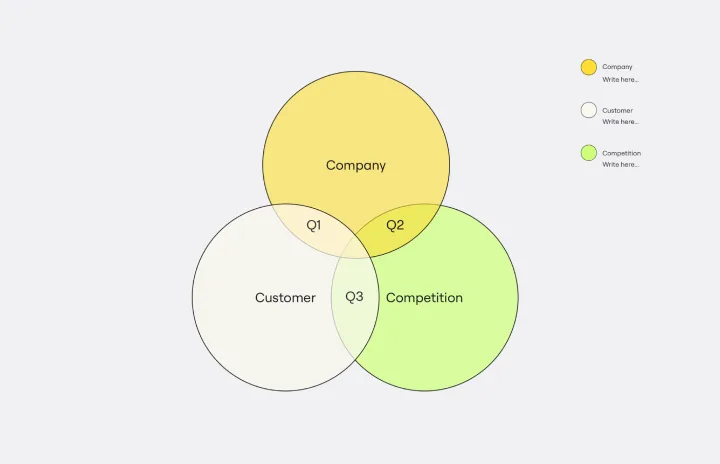
3C Analysis Template
Works best for:
Marketing, Strategic Planning
The 3C Analysis Template is a powerful tool that can help you analyze your business environment, identify opportunities for growth, and guide your business strategy. By using the template, you can collaborate with your team in real time, customize the template to fit your needs, and save time, making it an essential tool for any business looking to stay ahead of the competition.

Flyer Maker Template
Works best for:
Design, Marketing
Whether it’s a client party or a nonprofit fundraiser, your event needs one key thing to be a smashing success: people to show up. That’s why promoting it is such an important part of the planning—and creating and sending a flyer is the first step. These single-page files will grab your guests’ attention and give them the key details, such as the time, date, and location (and if it’s a fundraiser, who/what the funds will benefit). This template will let you lay out text and customize a flyer design.
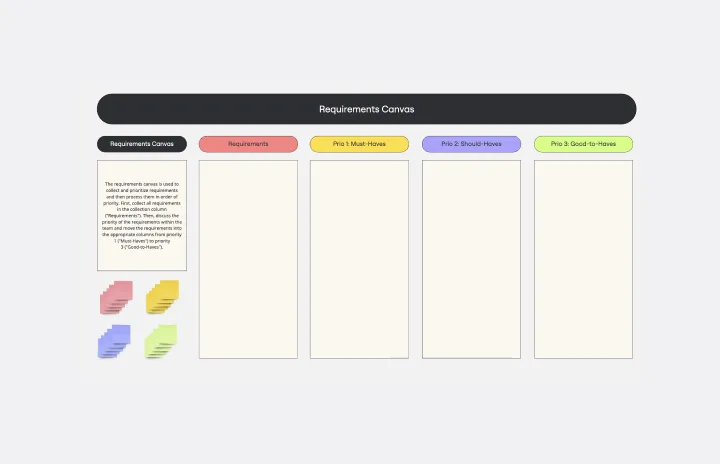
Requirements Gathering Template
Works best for:
Product , Strategy and Planning
The Requirements Gathering Template is an indispensable tool for project teams. It is the perfect solution for those who want to ensure their objectives are crystal clear and prioritize them efficiently. The three-category hierarchy created by this template - must-haves, should-haves, and good-to-haves - is an excellent way to streamline project requirements and allocate resources effectively. Any project team looking to optimize their workflow should consider this tool a must-have. It is a shining example of organized foresight, which is critical in today's world, where clarity is crucial.
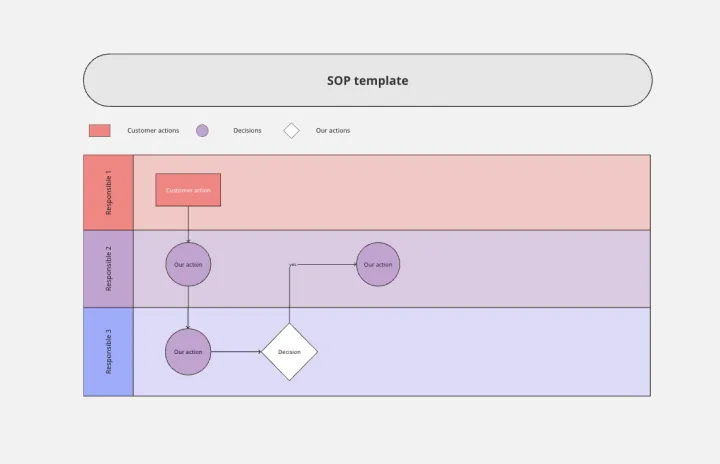
SOP Template
Works best for:
Business Planning
The SOP (Standard Operating Procedure) Template enhances efficiency, transparency, and collaboration within your organization. Take your operations to the next level, streamlining your business processes.
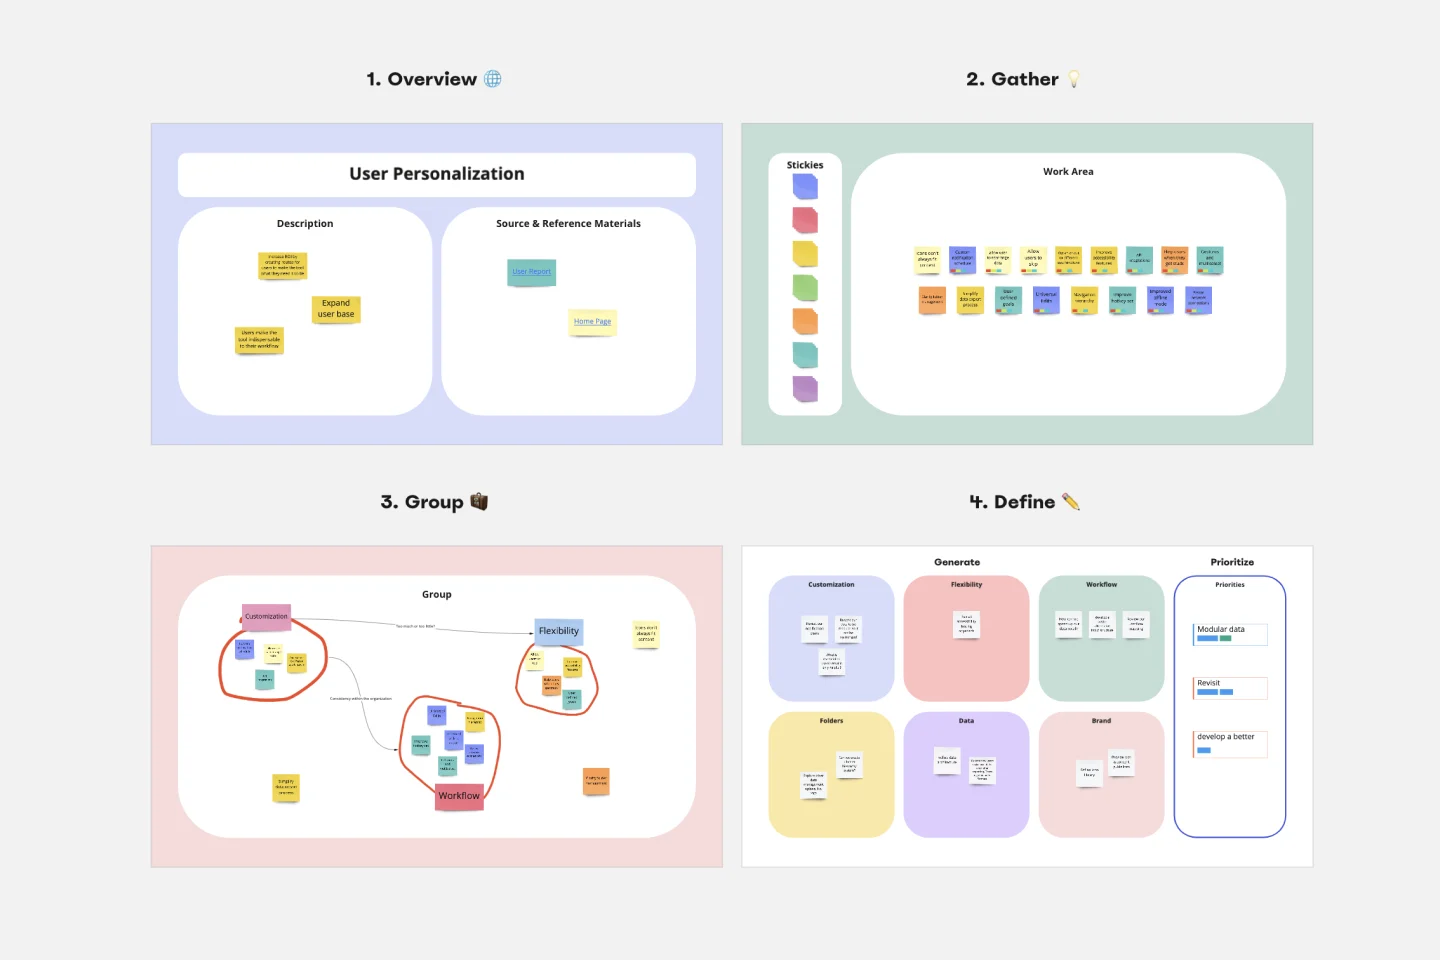
Affinity Diagram Template
Works best for:
Desk Research, Mapping, Product Management
You can use an affinity diagram to generate, organize, and consolidate information that comes out of a brainstorming session. Whether you’re building a product, working through a complex problem, establishing a process, or piecing apart an issue, an affinity diagram is a useful and simple framework that gives each team member the opportunity to pitch in and share their thoughts. But it’s not just ideal for brainstorms—this is a great template and tool when you need to reach consensus or analyze data such as survey results.