Double Bubble Map Template
Unlock the potential of visual thinking and enhance your team's collaboration with Miro's double bubble map template. Explore the endless possibilities for brainstorming, problem-solving, and ideation.
Trusted by 65M+ users and leading companies


About the Double Bubble Map Template
Brainstorm, analyze, and compare ideas or concepts in a structured and engaging way with Miro's double bubble map template. Whether planning a project, facilitating a discussion, or organizing your thoughts, this template enables creativity and clarity within your team.
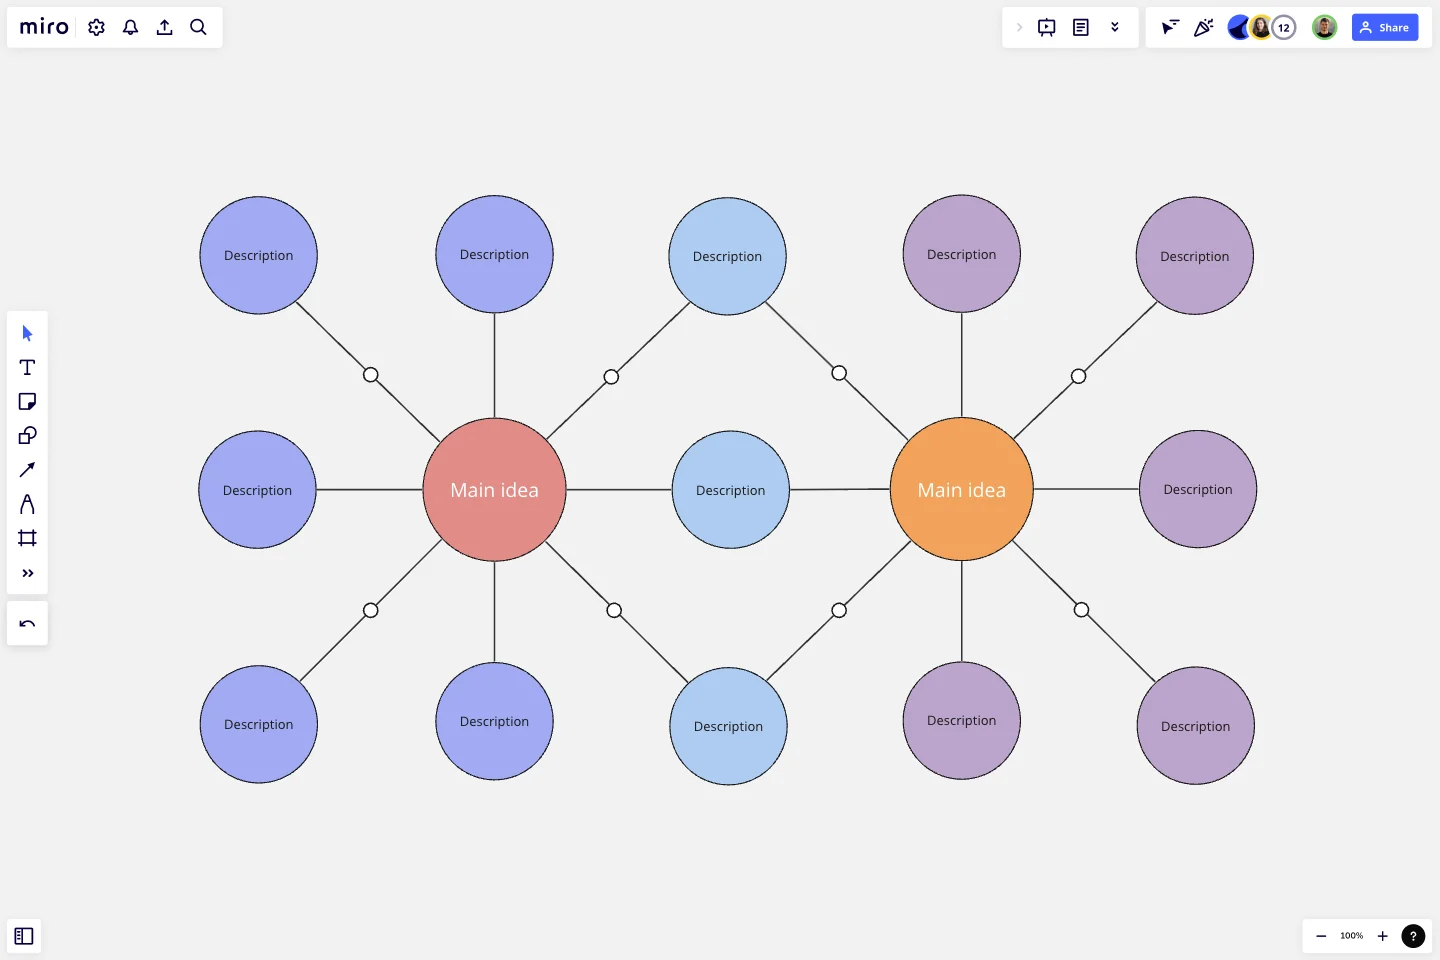
What's a double bubble map template?
A double bubble map template is a visual diagramming tool that allows teams to explore relationships and connections between central ideas or concepts. It consists of two interconnected bubbles, each representing one of the main ideas. Lines and connecting elements extend from these bubbles to show the ideas' relationships, similarities, and differences. This template is a dynamic framework for brainstorming, organizing information, and gaining insights into complex topics by visualizing how ideas interrelate.
Benefits of using the double bubble map template
Enhanced clarity: The double bubble map helps teams clarify their thoughts and ideas by visually representing the connections between two central concepts. This clarity minimizes misunderstandings and ensures everyone is on the same page.
Efficient brainstorming: It fosters efficient brainstorming sessions, encouraging teams to explore the intersections of ideas and identify potential areas of synergy or conflict.
Improved decision-making: Teams can make more informed decisions by using the template to weigh the pros and cons of different options, making it a valuable tool for problem-solving.
Effective communication: Visualizing complex relationships makes communicating ideas within the team and with stakeholders easier, promoting effective collaboration.
Customization: Miro's double bubble map template is highly customizable, allowing teams to adapt it to their specific needs and preferences.
How to use the double bubble map template in Miro
Creating a double bubble map diagram in Miro is a breeze:
Add the template: Search the Miro Template Library for the "Double Bubble Map Template." Click to add it to your board.
Customize your map: Double-click on the bubbles to add your central ideas. Use Miro's drawing tools and connectors to visualize the relationships and details.
Collaborate with others: Share the board link with your team members and collaborate in real time, whether in the same room or working remotely. Discuss, share, and refine your ideas quickly with Miro's bubble map maker.
Can I add more than two central ideas to the double bubble map template?
The double bubble map template in Miro is primarily designed for comparing two main ideas. However, you can create multiple templates within a board to effectively compare more than two concepts.
Can I export or print my double bubble map for offline use?
Yes, you can export your double bubble map as an image or PDF from Miro, making it easy to share or print for offline reference.
Are there collaboration restrictions on the double bubble map template in Miro?
No, Miro allows real-time collaboration for all users on a board, so your team can work together seamlessly on your double bubble map.
Get started with this template right now.
Business Intelligence Architecture Template
Works best for:
Diagramming
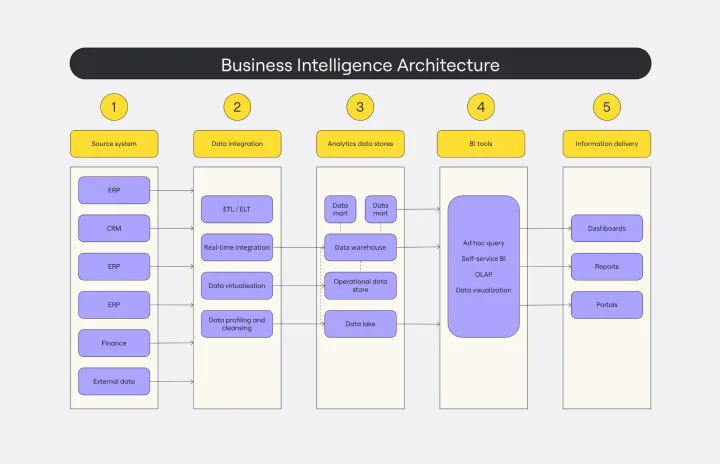
The Business Intelligence Architecture Diagram Template in Miro visually maps the complex landscape of business intelligence systems. With elements encompassing data sources, warehouses, ETL processes, tools, and end-user interfaces, the template enables users to communicate complex concepts with clarity. One standout feature is the template's dynamic adaptability, empowered by Miro's automated diagramming capabilities. This feature ensures that the diagram remains up-to-date with minimal effort, allowing users to effortlessly incorporate changes in data structures and processes, thus maintaining the relevance and accuracy of their visual representations over time.
Genogram Template
Works best for:
Diagramming
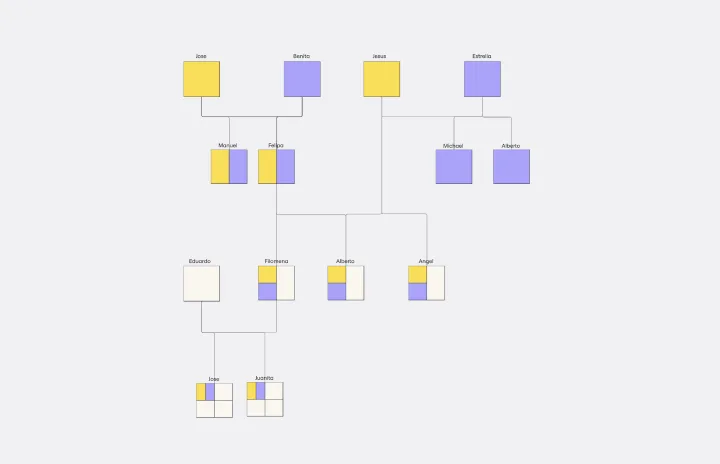
The Genogram Template maps out family structures and relationships with exceptional depth and detail. Unlike traditional family trees, this template provides a comprehensive perspective by encapsulating familial connections, emotional ties, and significant life events. Create a genogram to unearth patterns and trends within a family, whether hereditary or environmental. Professionals across different domains can gain a holistic understanding of familial dynamics by showing deep insights into the nuances of relationships, facilitating better communication and problem-solving.
Lotus Diagram Template
Works best for:
UX Design, Ideation, Diagrams
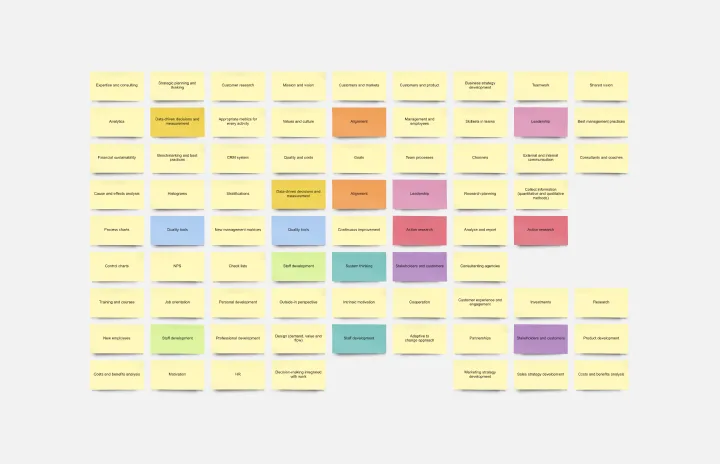
Even creative thinkers occasionally need help getting their creative juices flowing. That's where a lotus diagram comes in. It'll empower you to run smoother, more effective brainstorming sessions. This creative-thinking technique explores ideas by putting the main idea at the diagram center and ancillary concepts in the surrounding boxes. This template gives you an easy way to create Lotus Diagrams for brainstorms, as well as an infinite canvas for the endless ideas generated.

UML State Machine Diagram Template
Works best for:
Software Development, Mapping, Diagrams
Visualize the workflow of a process and how objects perform actions based on different stimuli. State machine diagrams are valuable for understanding how an object responds to events at the different stages of its life cycle. They are also helpful for visualizing event sequences in a system.
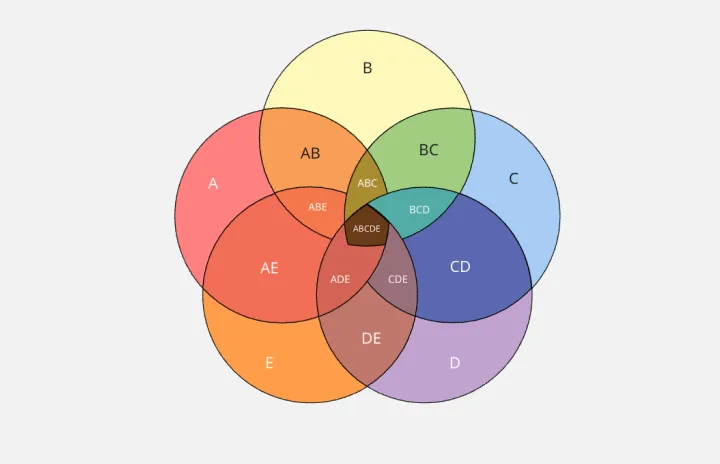
5-Circle Venn Diagram Template
Works best for:
Diagramming, Mapping, Brainstorming
Discover how Miro's 5 Circle Venn Diagram Template can simplify complex decision-making processes. Learn how to create, customize, and share your diagrams for effective visual collaboration. Transform brainstorming sessions with real time, remote teamwork.
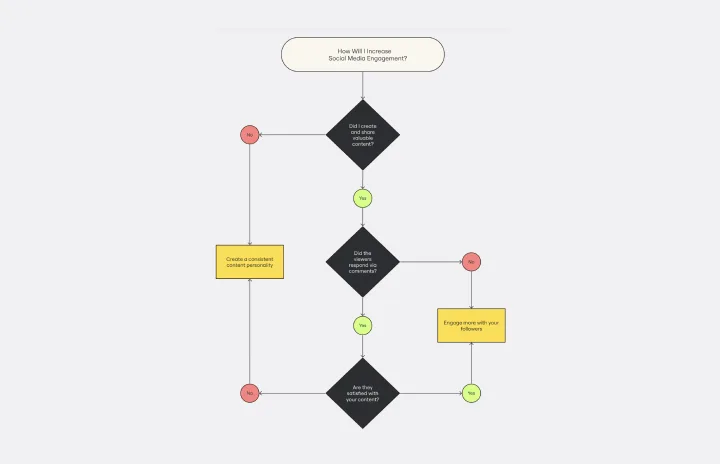
Yes No Flowchart Template
Works best for:
Diagramming
The Yes-No Flowchart Template is a simple and efficient tool that helps to simplify complex decision-making processes into clear and easy-to-follow steps. This template uses standard shapes to illustrate processes, decisions, and outcomes, with arrows that guide users from one action point to the next based on binary 'yes' or 'no' decisions. Its most prominent benefit is its ability to bring clarity to decision-making. By presenting processes visually, teams can effortlessly understand and navigate complex scenarios, ensuring that each step is transparent and reducing the potential for misunderstandings or missteps.