5-Circle Venn Diagram Template
Visualize relationships between many datasets, and make more informed decisions, stimulating creative thinking and fostering more productive discussions with Miro’s 5-circle Venn Diagram Template.
Trusted by 65M+ users and leading companies


About the 5-circle Venn Diagram Template
To harness the power of visualization in problem-solving, planning, or brainstorming, Miro presents the 5 Circle Venn Diagram Template. This template is designed to help users identify and display the logical relationships among five groups, making the decision-making process more efficient and effective.
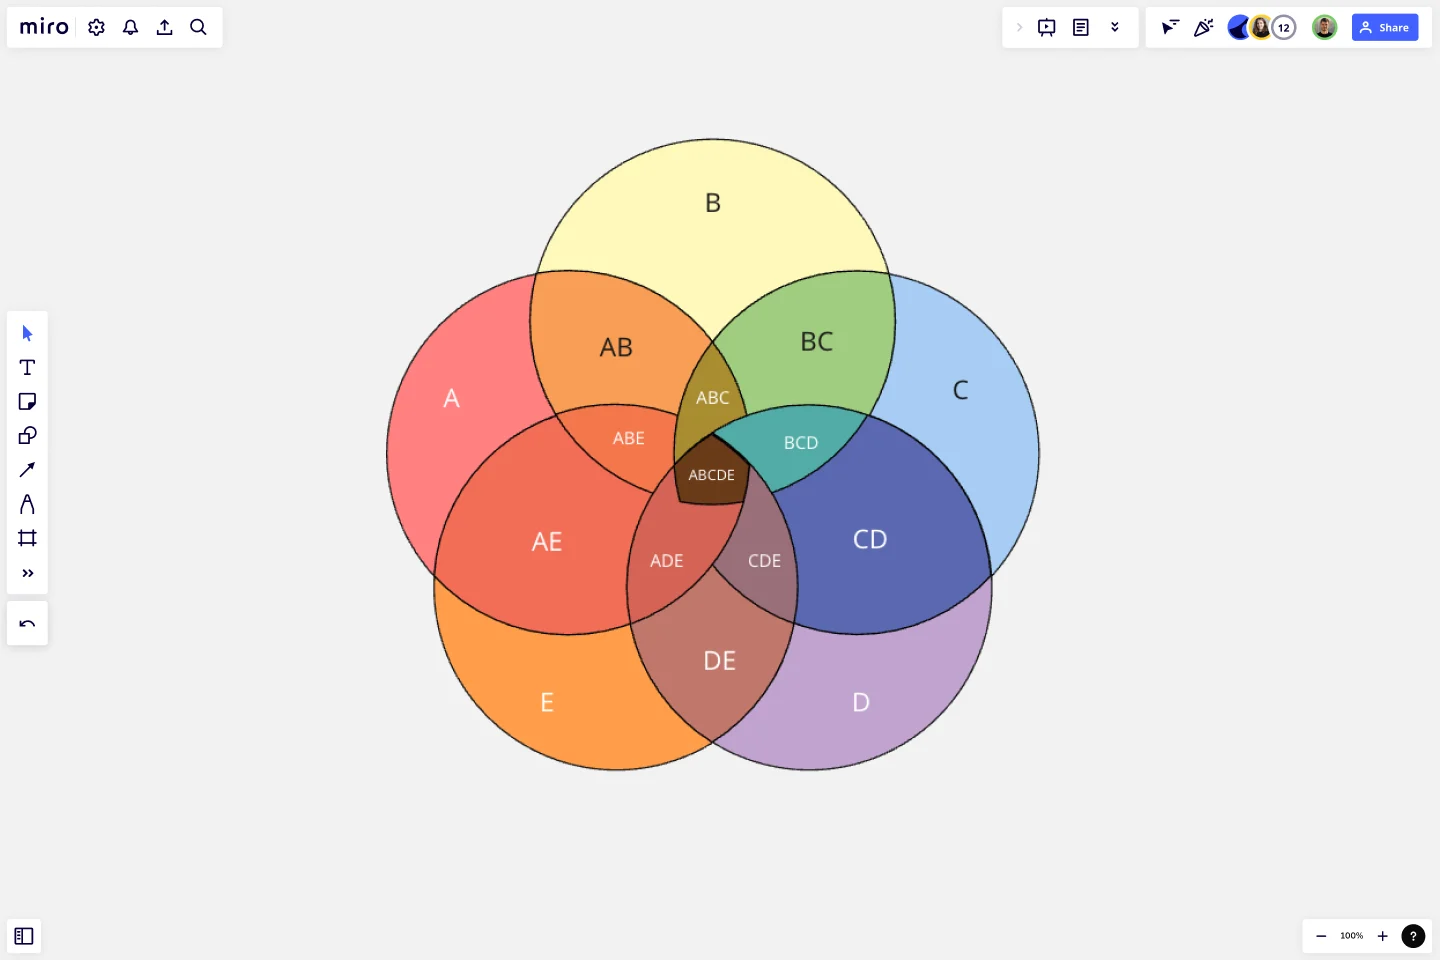
What's a 5-circle Venn Diagram Template?
A 5 Circle Venn Diagram Template is a diagramming tool that visually showcases the overlap and intersection of five different groups or categories. Each circle represents a category, and the overlap between circles indicates a commonality among those categories. By arranging these circles to intersect at various points, one can map out the relationship and interactions between diverse elements, revealing patterns, and potential connections.
How to use the 5-circle Venn Diagram Template
Step 1: Select the 5-circle Venn Diagram Template Choose the 5 Circle Venn Diagram Template from Miro's template library.
Step 2: Customize the template Once the template is on your Miro board, you can edit it. This includes changing the size and color of the circles, adjusting their positioning, or adding labels and descriptions.
Step 3: Add text and labels For each circle, add text that accurately represents the category. Then, in the overlapping sections of the circles, write down the commonalities between the respective categories.
Step 4: Collaborate with your team Now, you're ready for a brainstorming session. Miro allows real time collaboration, so invite your team members to contribute to the diagram. They can add their ideas, suggestions, or insights to the Miro board.
Step 6: Save and share the 5-circle Venn Diagram Once the session ends, you can save the diagram for future reference. Miro offers various export options, including JPEG, PNG, and PDF. You can also share the diagram directly from the platform via email or link, ensuring that all stakeholders can easily access the information.
Miro is the perfect Venn diagram maker with a range of available templates and the ability to customize everything, from the number of circles to labeling and colors. Create professional Venn diagrams that will help you explain complex topics with confidence.
Can a 5-circle Venn Diagram Template handle more than five categories?
While the 5-circle Venn Diagram Template is optimized for five categories, users can technically add additional circles or use other diagramming tools offered by Miro to manage a higher number of categories.
Is the 5-circle Venn Diagram Template suitable for remote collaboration?
Absolutely. Miro's platform is designed for seamless remote collaboration. Multiple team members can work on the same diagram simultaneously in real time, making it an excellent tool for distributed teams.
Can users save and share the 5-circle Venn Diagram created in Miro?
Yes. Diagrams created using Miro's 5-circle Venn Diagram Template can be easily saved and shared. Miro offers a range of export options, including JPEG, PNG, and PDF, and diagrams can be shared directly from the platform via email or link.
Is it possible to customize the 5-circle Venn Diagram Template in Miro?
Miro's templates, including the 5-circle Venn Diagram, are fully customizable. Users can adjust the circles' size, color, and positioning, add or delete text fields, and incorporate additional elements as needed.
Get started with this template right now.
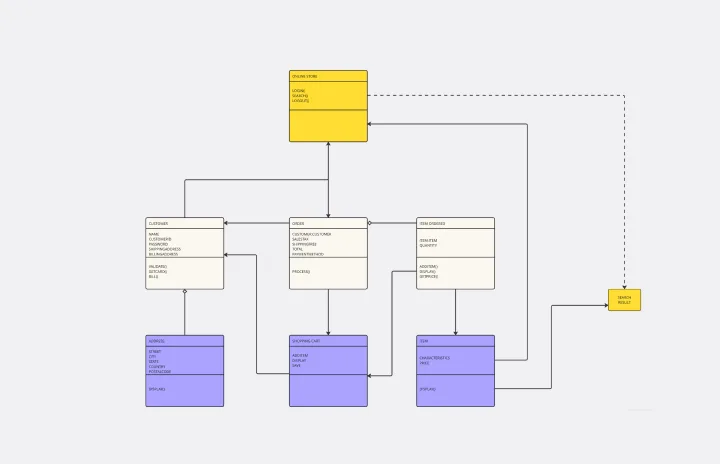
UML Diagram Template
Works best for:
Diagrams, Software Development
Originally used as a modeling language in software engineering, UML has become a popular approach to application structures and documenting software. UML stands for Unified Modeling Language, and you can use it to model business processes and workflows. Like flowcharts, UML diagrams can provide your organization with a standardized method of mapping out step-by-step processes. They allow your team to easily view the relationships between systems and tasks. UML diagrams are an effective tool that can help you bring new employees up to speed, create documentation, organize your workplace and team, and streamline your projects.
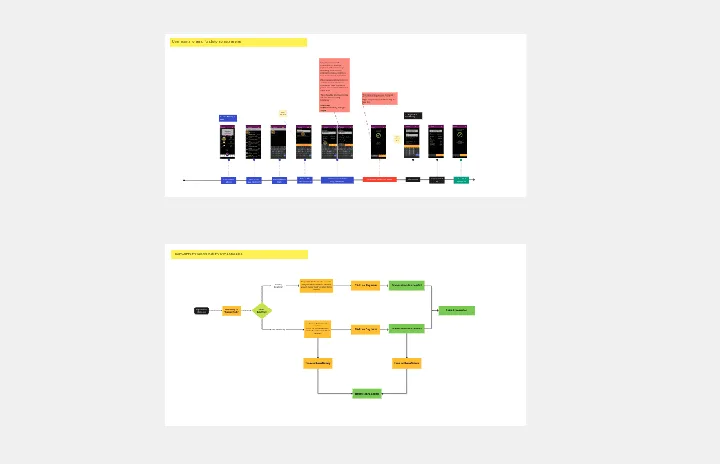
Bank Mobile App User Journey
Works best for:
Diagramming
The Bank Mobile App User Journey template offers a visual framework for mapping out the user experience journey within a banking mobile application. It provides elements for visualizing user interactions, touchpoints, and emotions throughout the journey. This template enables teams to understand user needs, pain points, and opportunities for improvement, facilitating the design of user-friendly and intuitive banking apps. By promoting empathy and user-centric design, the Bank Mobile App User Journey template empowers teams to create digital experiences that meet customer expectations and drive engagement.

2-Circle Venn Diagram Template
The 2 Circle Venn Diagram Template is a dynamic, intuitive tool designed to represent the logical relationships between two data sets visually. For teams, this template proves valuable in enabling efficient collaboration, clear communication, and shared understanding.

UML Communication Diagram Template
Works best for:
Software Development, Mapping, Diagrams
Most modern programs consist of many moving parts working to a precise set of instructions. With a communication diagram, you can visualize exactly how those parts work together, giving you a clearer understanding of your program as a whole. What’s more, the diagram leaves spaces for expanding the network of relationships as your product grows and evolves. A communication diagram is a vital tool in any software designer’s arsenal.
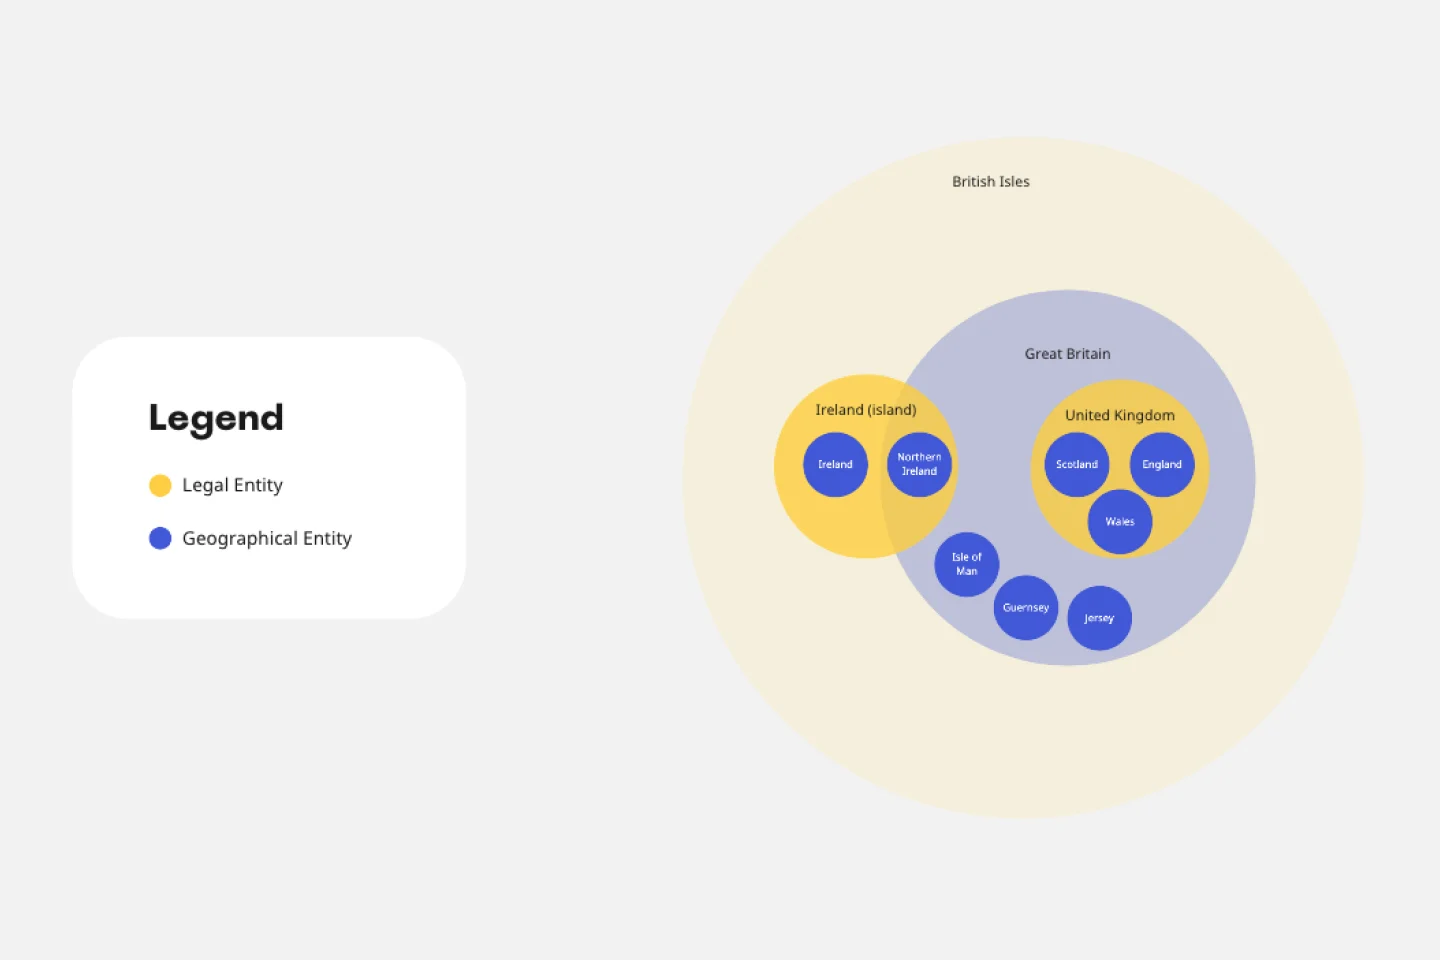
Euler Diagram Template
Works best for:
Business Management, Operations, Diagrams
Euler diagrams are valuable for showing different relationships between subjects by representing them with circles or "cells." Euler diagrams are frequently used in IT systems to show how objects relate to one another and how they interact. However, you can use them for any sort of explanation that needs to show connections.
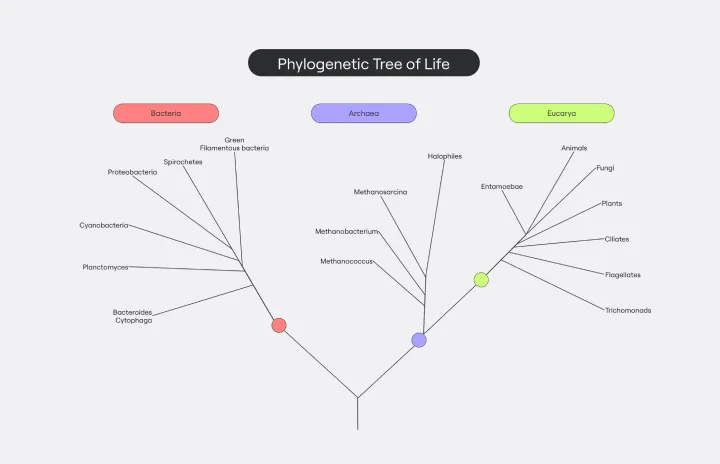
Phylogenetic Tree Template
Works best for:
Diagramming
The Phylogenetic Tree Template is a powerful tool that allows scientists and researchers to visualize evolutionary relationships between species. It is a visual representation of the history of the evolution of life on Earth and helps users identify the relationships between other organisms and their ancestors. The key benefit of this template is that it organizes complex data and makes it more understandable to everyone. Additionally, it offers an efficient way to collect and analyze data, saving time and effort and enabling users to identify significant patterns and relationships in the data.