2-Circle Venn Diagram Template
Simplify complex ideas, boost team collaboration, and foster innovative insights with the 2-Circle Venn Diagram Template. It's an all-encompassing tool that improves your decision-making and brainstorming processes.
Trusted by 65M+ users and leading companies


About the 2 Circle Venn Diagram Template
The 2 Circle Venn Diagram Template is one tool that helps teams to collaborate and communicate better. Whether for business strategy, education, or simply brainstorming, this universal template allows you to illustrate connections and disparities and distill complex data into digestible visual information.
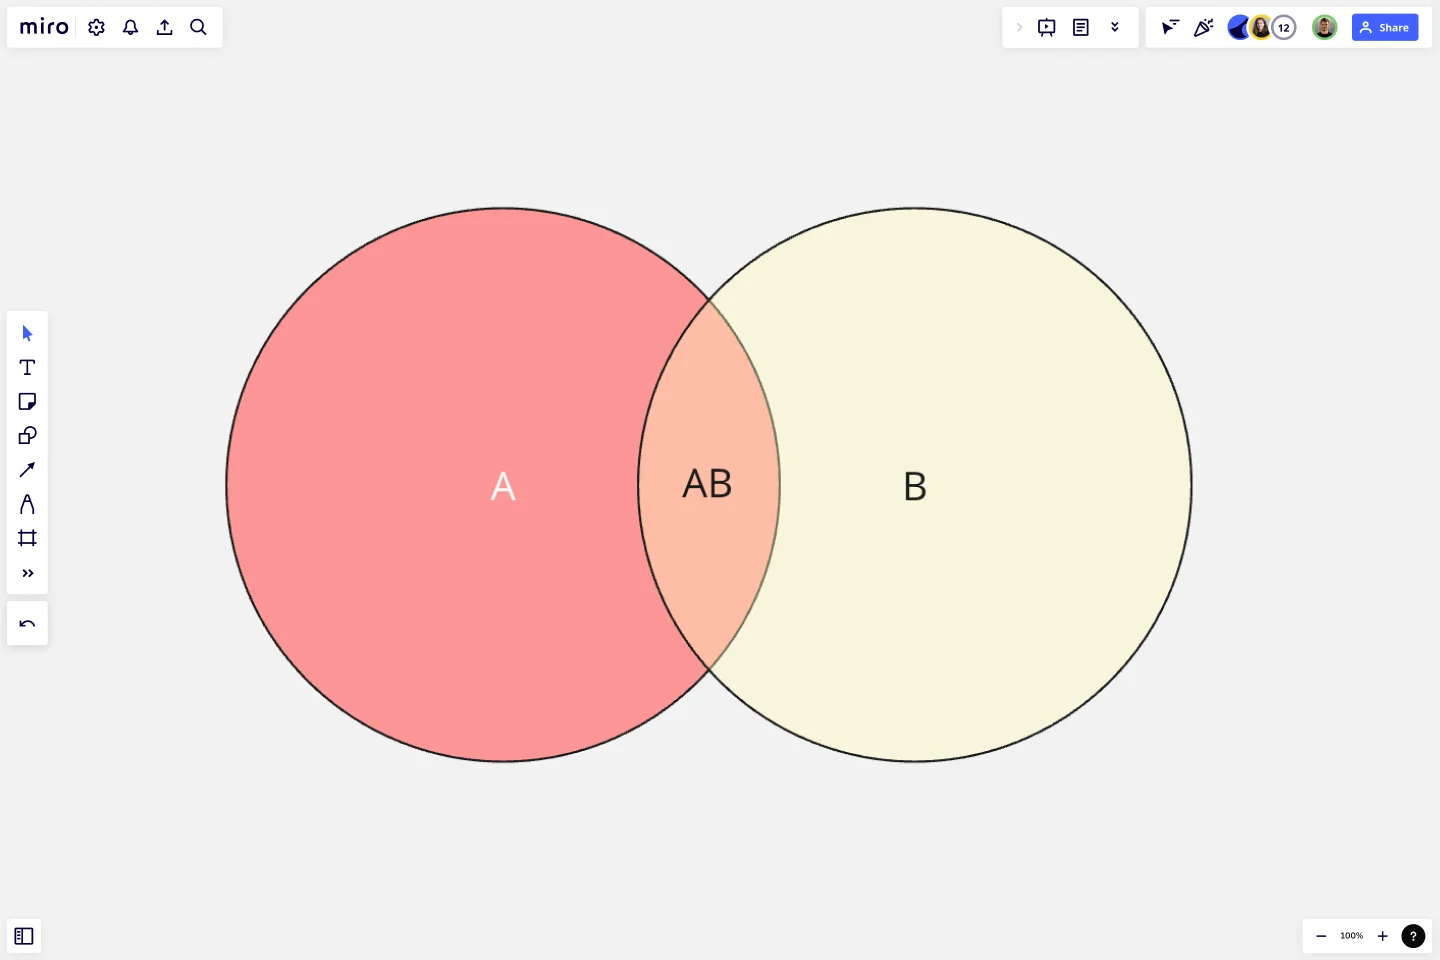
What's a 2-Circle Venn Diagram Template?
A 2-Circle Venn Diagram is a visual representation that maps the relationship between two distinct groups or sets of data. It consists of two overlapping circles, where each circle symbolizes a unique set. These circles' overlapping or intersecting area delineates shared traits or commonalities between these sets. Venn diagrams are an easy-to-understand visual tool that allows you to represent complex relationships, compare and contrast different entities, and stimulate thought-provoking discussions.
How to use a 2-Circle Venn Diagram Template in Miro?
Step 1: Select the 2-Circle Venn Diagram Template and add it to your board.
Step 2: Once the template is on your board, label each circle to represent the two sets or groups you are comparing and contrasting.
Step 3: Fill your circles with respective data points or ideas. Depending on your project's requirements, these could be anything from product features to business strategies.
Step 4: Use Miro's automated diagramming features for an impeccably neat and professional look. These tools automatically align and space your elements, helping you maintain consistency throughout your diagram.
Step 5: Edit your 2-circle Venn diagram effortlessly. Adjust, move, and edit elements until you achieve a layout that serves your purpose best.
Step 6: Finally, invite your team members to collaborate. They can simultaneously work on the diagram, provide real time feedback, and contribute to it. Once satisfied with your Venn Diagram, you can share it with others via a link or present it in a meeting.
Remember, practice makes perfect. The more you use the 2 Circle Venn Diagram Template in Miro, the more fluent you'll become at visualizing and communicating complex relationships and ideas. Miro is the perfect Venn diagram maker with a range of available templates and the ability to customize everything, from the number of circles to labeling and colors. Happy diagramming!
Can I customize my 2 Circle Venn Diagram Template in Miro?
Absolutely! Change the size, colors, and labels of the circles, as well as the fonts used, thereby aligning your diagram with your project's unique aesthetics or your personal preferences.
Can multiple team members collaborate on a single Venn Diagram?
Yes. Team members can work simultaneously on the same Venn Diagram, making it a truly interactive experience. They can add comments, provide real-time feedback, and contribute to the diagram, enhancing team synergy.
Does Miro support data import for creating Venn Diagrams?
Yes, Miro supports data import from a range of formats. This functionality streamlines the process of inputting the necessary information into your Venn Diagram, saving you time and ensuring accuracy.
Can I share my Venn Diagram with people who do not have a Miro account?
Yes, Miro allows you to share your Venn Diagram via a link. The receivers can view it without a Miro account. However, if they need to edit or contribute, they must create a free account.
Get started with this template right now.
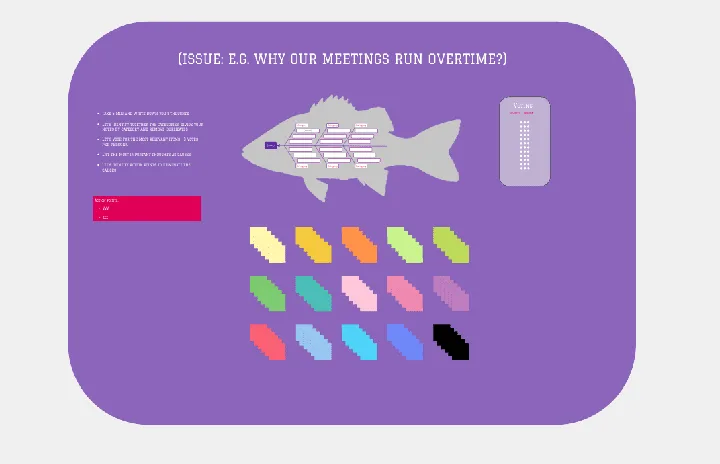
Fishbone Diagram by Hanna Havulinna
Works best for:
Diagramming
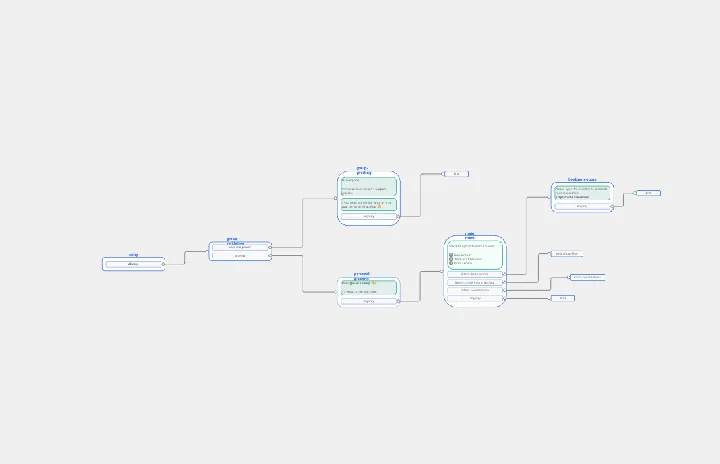
The Fishbone Diagram template, also known as the Ishikawa or Cause-and-Effect diagram, offers a visual tool for identifying and analyzing root causes of problems or issues. It provides a structured framework for categorizing potential causes into major categories such as people, process, environment, and equipment. This template enables teams to conduct root cause analysis systematically, facilitating problem-solving and decision-making. By promoting a structured approach to problem analysis, the Fishbone Diagram empowers teams to address issues effectively and implement corrective actions efficiently.
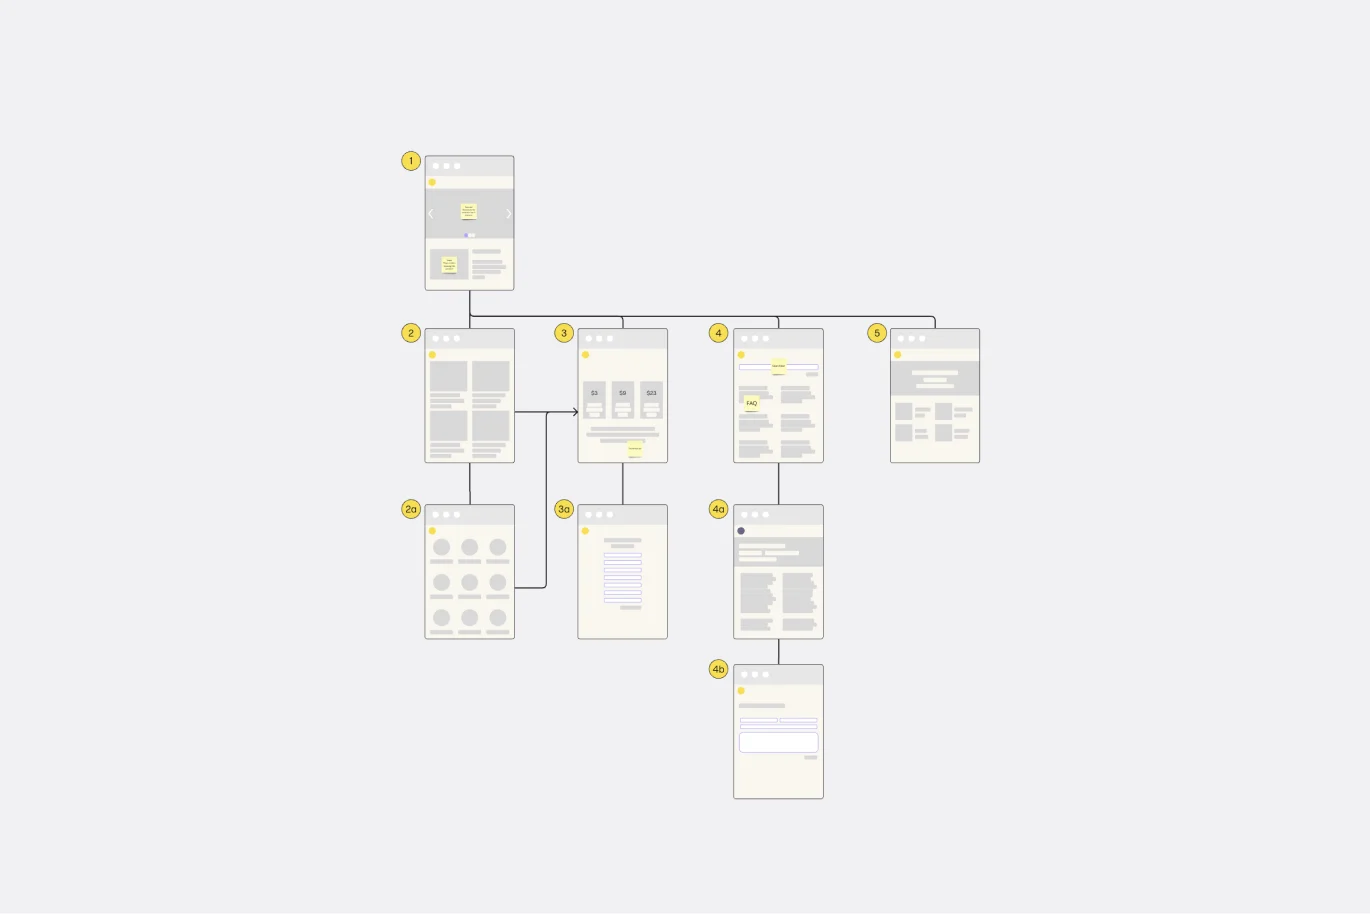
Website Flowchart Template
Works best for:
Flowcharts, Mapping, User Experience
A website flowchart, also known as a sitemap, maps out the structure and complexity of any current or future website. The flowchart can also help your team identify knowledge gaps for future content. When you’re building a website, you want to ensure that each piece of content gives users accurate research results based on keywords associated with your web content. Product, UX, and content teams can use flowcharts or sitemaps to understand everything contained in a website, and plan to add or restructure content to improve a website’s user experience.
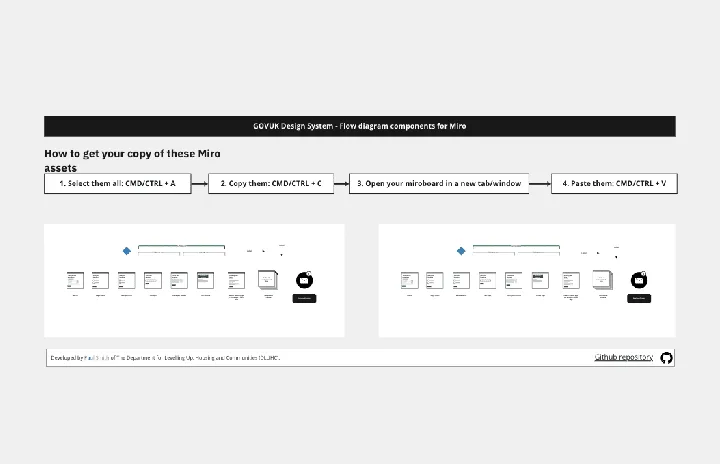
Flow Diagrams
Works best for:
Diagramming
The Flow Diagrams template offers a versatile tool for visualizing processes, workflows, and systems. It provides a range of shapes and connectors for creating flowcharts, process maps, and data flow diagrams. This template enables teams to represent complex systems and processes in a clear and structured manner, facilitating communication and decision-making. By promoting visual clarity and understanding, Flow Diagrams empower teams to analyze and optimize processes effectively, driving efficiency and productivity.
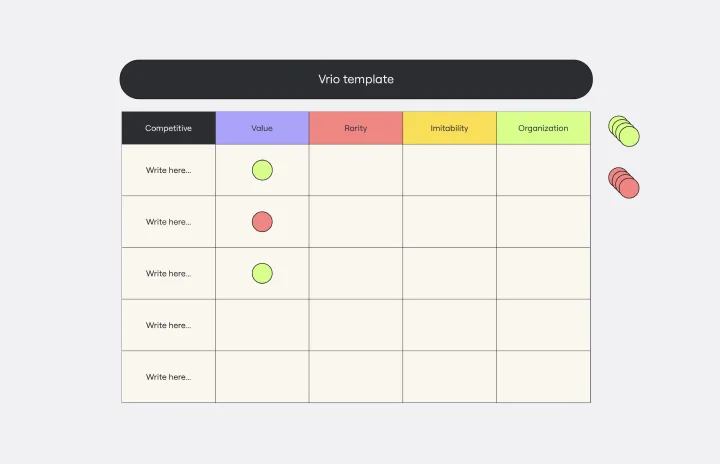
VRIO Analysis Template
Works best for:
Diagramming, Strategy
The VRIO Analysis Template is a framework that helps businesses evaluate their resources and capabilities for competitive advantage. It categorizes resources into four areas: Value, Rarity, Imitability, and Organization. This provides a comprehensive view of an organization's strengths and potential weaknesses. The template has the key benefit of offering quick visual insights. Decision-makers can immediately identify and focus on resources that are valuable, rare, hard to imitate, and well-organized. This ensures a sustainable competitive edge and saves time by avoiding lengthy textual analyses.

Login Sequence Diagram Template
Works best for:
Diagramming, Technical Diagramming
The UML Sequence Login Diagram Template is a valuable tool for visualizing user authentication processes. It breaks down complex login sequences into clear, visual components, facilitating collaborative understanding among team members, regardless of their technical expertise. This shared understanding is crucial for ensuring all stakeholders, from developers to project managers, are on the same page, leading to efficient decision-making and a smoother development process. The template's ability to translate technical details into an accessible format streamlines communication and significantly reduces the likelihood of misinterpretation or oversight, making it an essential asset in any software development project.
Chat-Bot
Works best for:
Diagramming
The Chat Bot template is a visual tool for designing and mapping out chatbot interactions and functionalities. It provides a structured framework for visualizing conversation flows, user inputs, and bot responses. This template enables teams to collaborate on designing chatbot experiences that are intuitive and user-friendly, driving engagement and satisfaction. By promoting clarity and alignment, the Chat-Bot template empowers organizations to create effective chatbot solutions that meet user needs and business objectives.