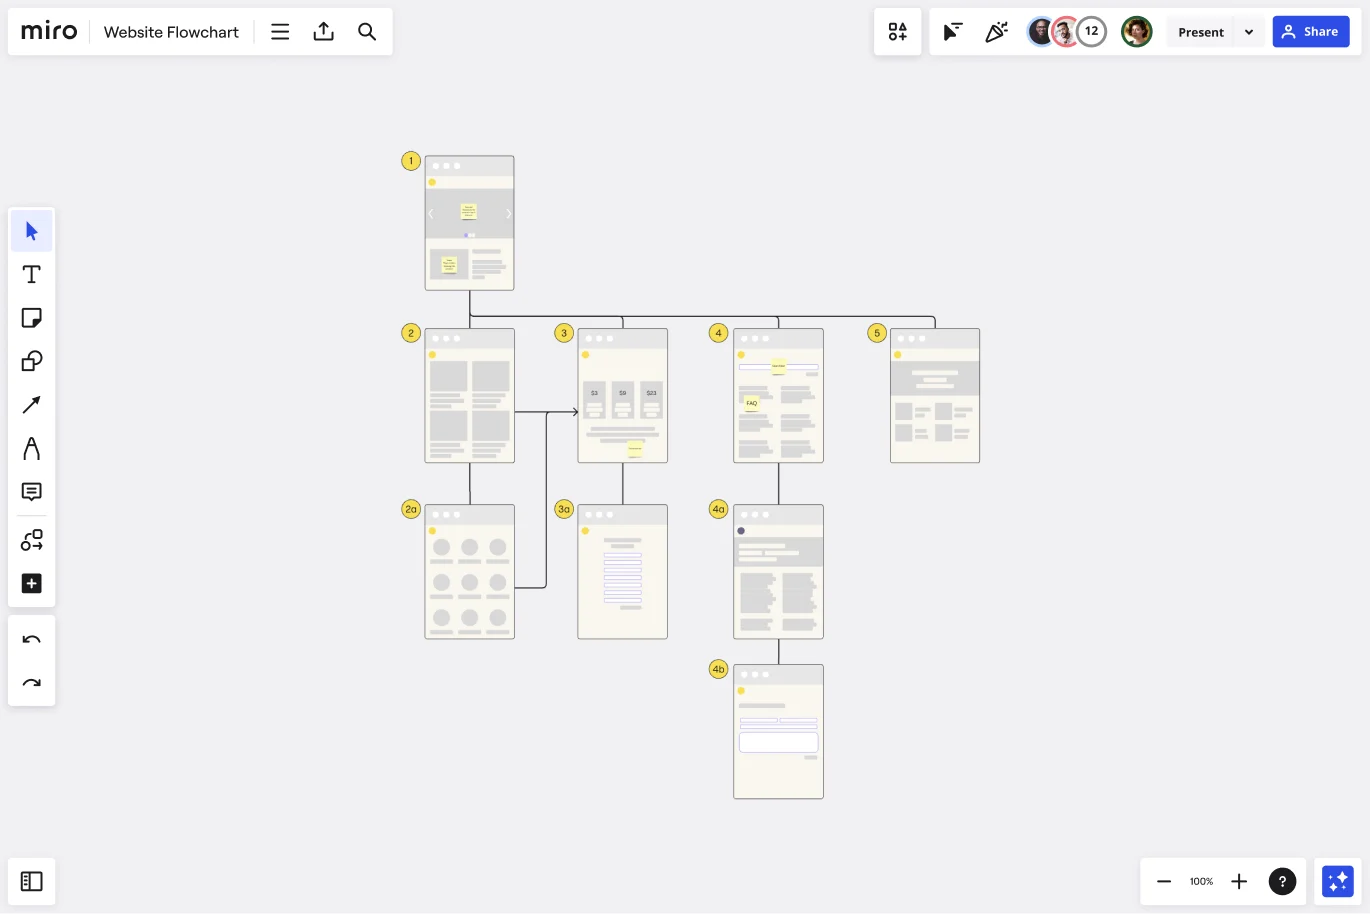
Website Flowchart Template
Organize and clarify your website content with the Website Flowchart Template. Build user-centric experiences and have customers always coming back.
Trusted by 65M+ users and leading companies


About the Website Flowchart Template
A website flowchart (also known as a sitemap) maps out the structure and complexity of your current or future website.
A well-structured sitemap or flowchart makes your website easily searchable. Each piece of content should ideally give users accurate search results, based on keywords connected to your web content.
Product, UX, and content teams use flowcharts or sitemaps to understand everything contained in a website, and plan to add or restructure content to improve a website’s user experience.
Keep reading to learn more about website flowcharts.
What is a website flowchart?
A website flowchart can be used as a planning tool to help organize and clarify existing content, and get rid of unnecessary or duplicate content. The flowchart also helps your team identify knowledge gaps for future content.
Website flowcharts help you stay focused on your user and your goals when working on website projects, from website launches, audits, or redesigns.
Ideally, your users shouldn’t be confused when navigating your website (whether it’s their first time or a returning visit), or interacting with any of your content. Website flowcharts help you spot areas of friction or dead-end points across user flows.
Create your own website flowchart
Making your own website flowchart is easy and Miro is the perfect flowchart creator. Get started by selecting the Website Flowchart Template, then take the following steps to make one of your own.
1. Clarify your website’s purpose and goals
Websites should be focused and easy to navigate. Ask your team to articulate your website’s high-level goals and purpose on sticky notes. These can be broken down into specific, color-coded goals for each webpage. Your sitemap should help you determine whether every page on your website truly reinforces your goals.
2. Add website wireframes and set your website flow
You can build your website flowchart based on a website wireframe or build a quick mock-up with the shapes and images from our library. Make sure what you build is showing your user experience accurately and indicates flow direction with arrows.
3. Identify duplicate content and flag it for review
Use the number labels on each webpage to map out the user flow or rank the relevance of each website from highest to lowest possible. Flag duplicate content with relevant symbols like emojis to mark potential conflicting information or pages that don’t convert.
4. Streamline your conversion funnel
After you’ve finished adding the necessary new pages to your sitemap, map out and combine any duplicate steps a user must take to complete a sign-up or purchase. The fewer steps, the sooner your potential user can convert. In this step, it’s also helpful to build a customer touchpoint map.
5. Share your sitemap cross-functionally
Lots of people are involved in website launches, audits, or redesigns: from web designers, project managers, and developers, to copywriters, and sales and marketing (at least!). To align everyone on the goals and progress of your website project, keep the flowchart visible and easily accessible to all.
Why use a website flowchart?
A sitemap can help your product, UX, or content teams:
Clarify content themes or focuses so the user understands your products and services
Reduce broken links across your website
Streamline the conversion funnel so the user takes fewer steps before converting
Maintain higher search engine rankings by planning regular content refreshes to maintain a competitive edge
Kickstart a new business or initiative, especially since sitemaps help content get discovered faster
Invite cross-functional input and collaborate, as the needs of the users and website or content architecture evolve
Use your website flowchart as a web design project tracker, too. Keep an eye on finalized website elements, what areas need development, and how much your team progresses.
How do you create a flowchart for a website?
There are many ways to create a website flowchart, but some of the best practices include conducting user research to understand your customer’s pain points, and collaborating with other teams such as design, product, and development to assess what’s feasible or not. Finally, test your prototypes, to be sure your website flowchart is good, user-friendly, and will reach your company’s goals.
Get started with this template right now.
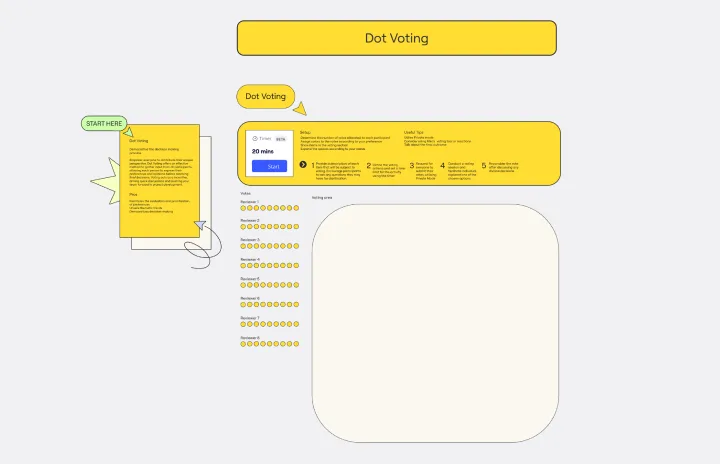
Dot Voting Template
Works best for:
Design
The Dot Voting Template is an excellent tool to gather input from all participants, enabling each person to express their preferences and opinions before reaching final decisions. Voting acts as an incentive, driving quick discussions and pushing your team forward in project development.
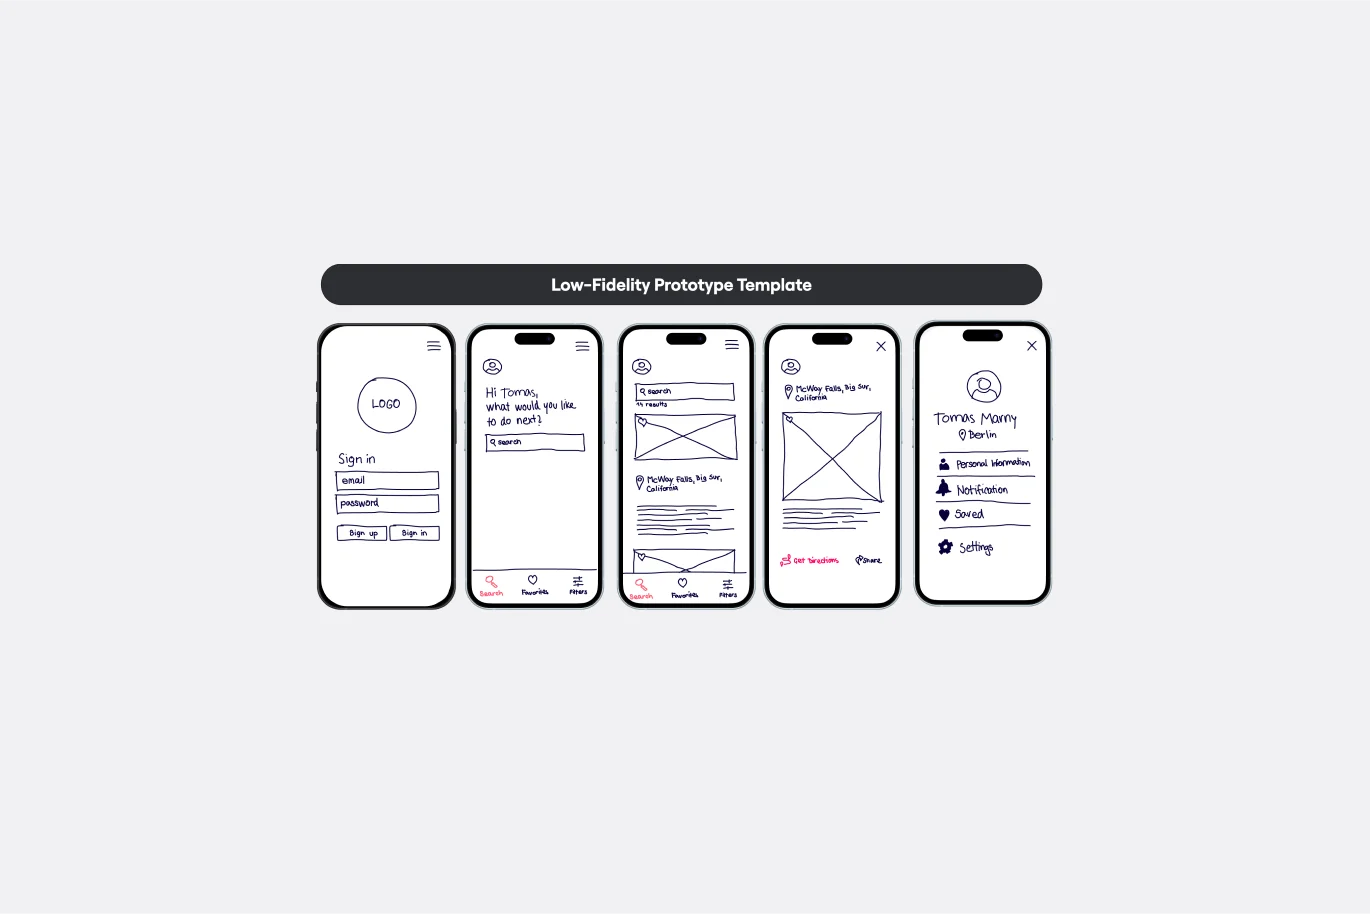
Low-Fidelity Prototype Template
Works best for:
Design, Desk Research, Wireframes
Low fidelity prototypes serve as practical early visions of your product or service. These simple prototypes share only a few features with the final product. They are best for testing broad concepts and validating ideas. Low fidelity prototypes help product and UX teams study product or service functionality by focusing on rapid iteration and user testing to inform future designs. The focus on sketching and mapping out content, menus, and user flow allows both designers and non-designers to participate in the design and ideation process. Instead of producing linked interactive screens, low fidelity prototypes focus on insights about user needs, designer vision, and alignment of stakeholder goals.
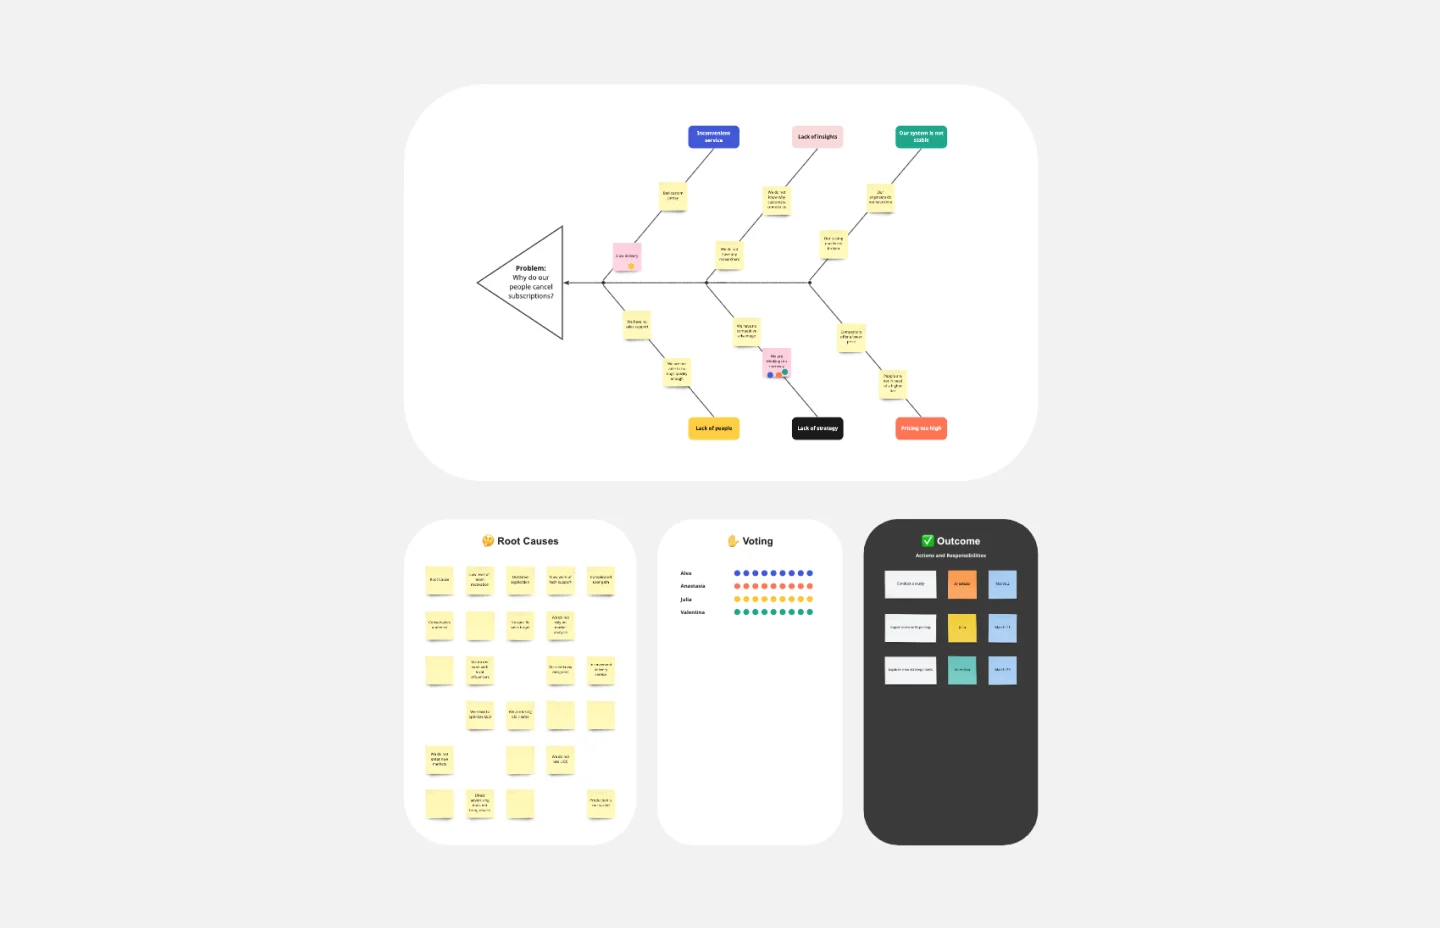
Fishbone Diagram Template
Works best for:
Operations, Diagrams, Workflows
What is the best way to solve any problem your team faces? Go straight to the root. That means identifying the root causes of the problem, and fishbone diagrams are designed to help you do it best. Also known as the Ishikawa Diagram (named after Japanese quality control expert Kaoru Ishikawa), fishbone diagrams allow teams to visualize all possible causes of a problem, to explore and understand how they fit together holistically. Teams can also use fishbone diagrams as a starting point for thinking about what the root cause of a future problem might be.
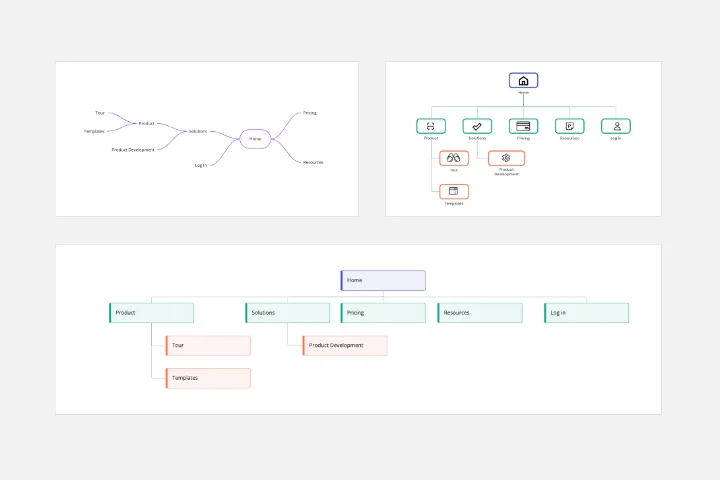
Sitemap Template
Works best for:
Mapping, Software Development, Diagrams
Building a website is a complex task. Numerous stakeholders come together to create pages, write content, design elements, and build a website architecture that serves a target audience. A sitemap is an effective tool for simplifying the website design process. It allows you to take stock of the content and design elements you plan to include on your site. By visualizing your site, you can structure and build each component in a way that makes sense for your audience.
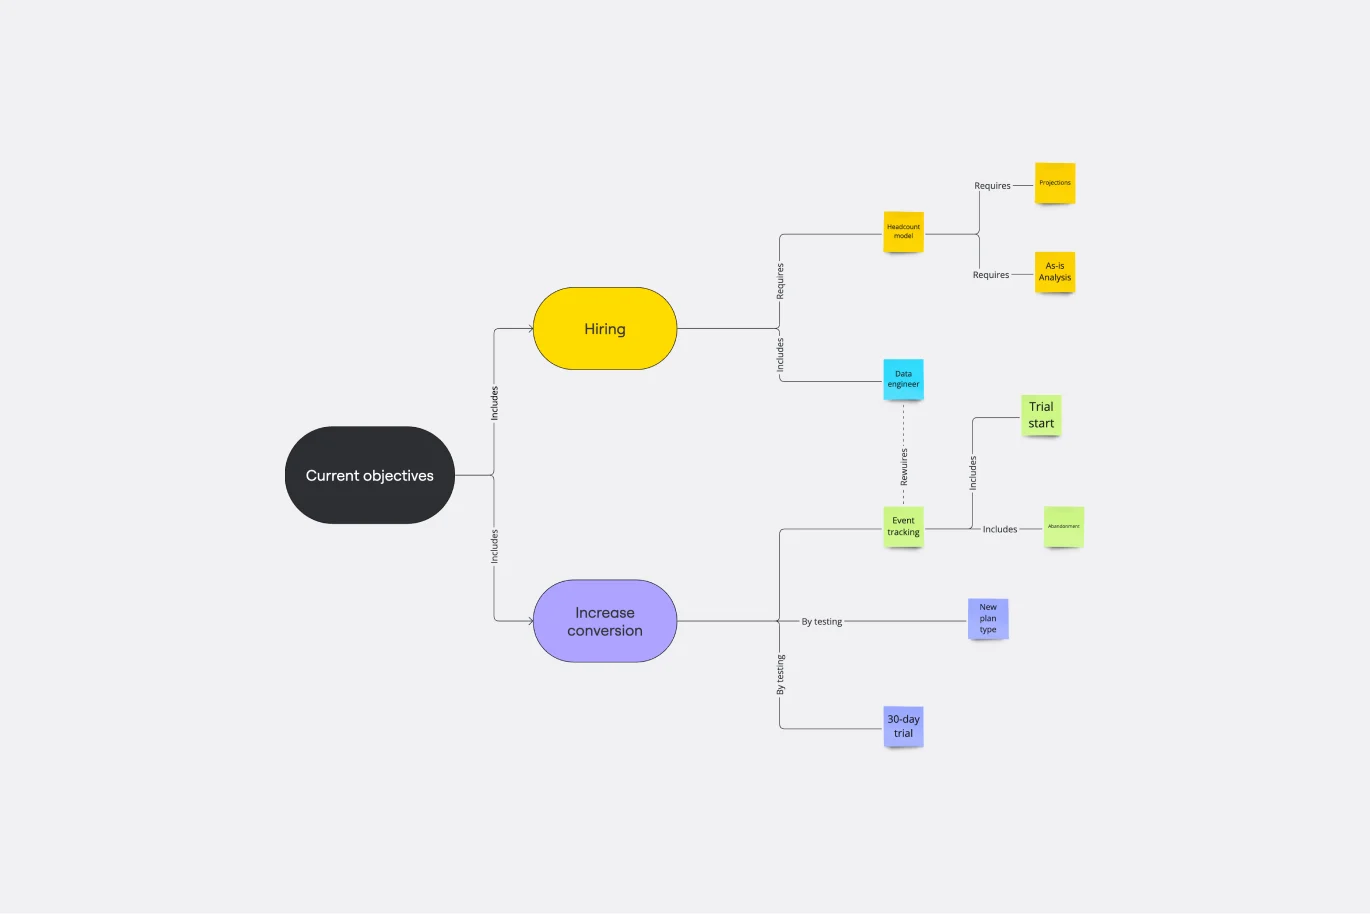
Concept Map Template
Works best for:
Education, Mapping, Brainstorming
Use the concept map template to create new ideas, structure your thoughts, and bring your innovations to life. It allows you to explore connections between concepts and let your creativity flow in an organized format. As a result, you’re able to visualize how to bring your new ideas to reality and how various concepts relate to each other.
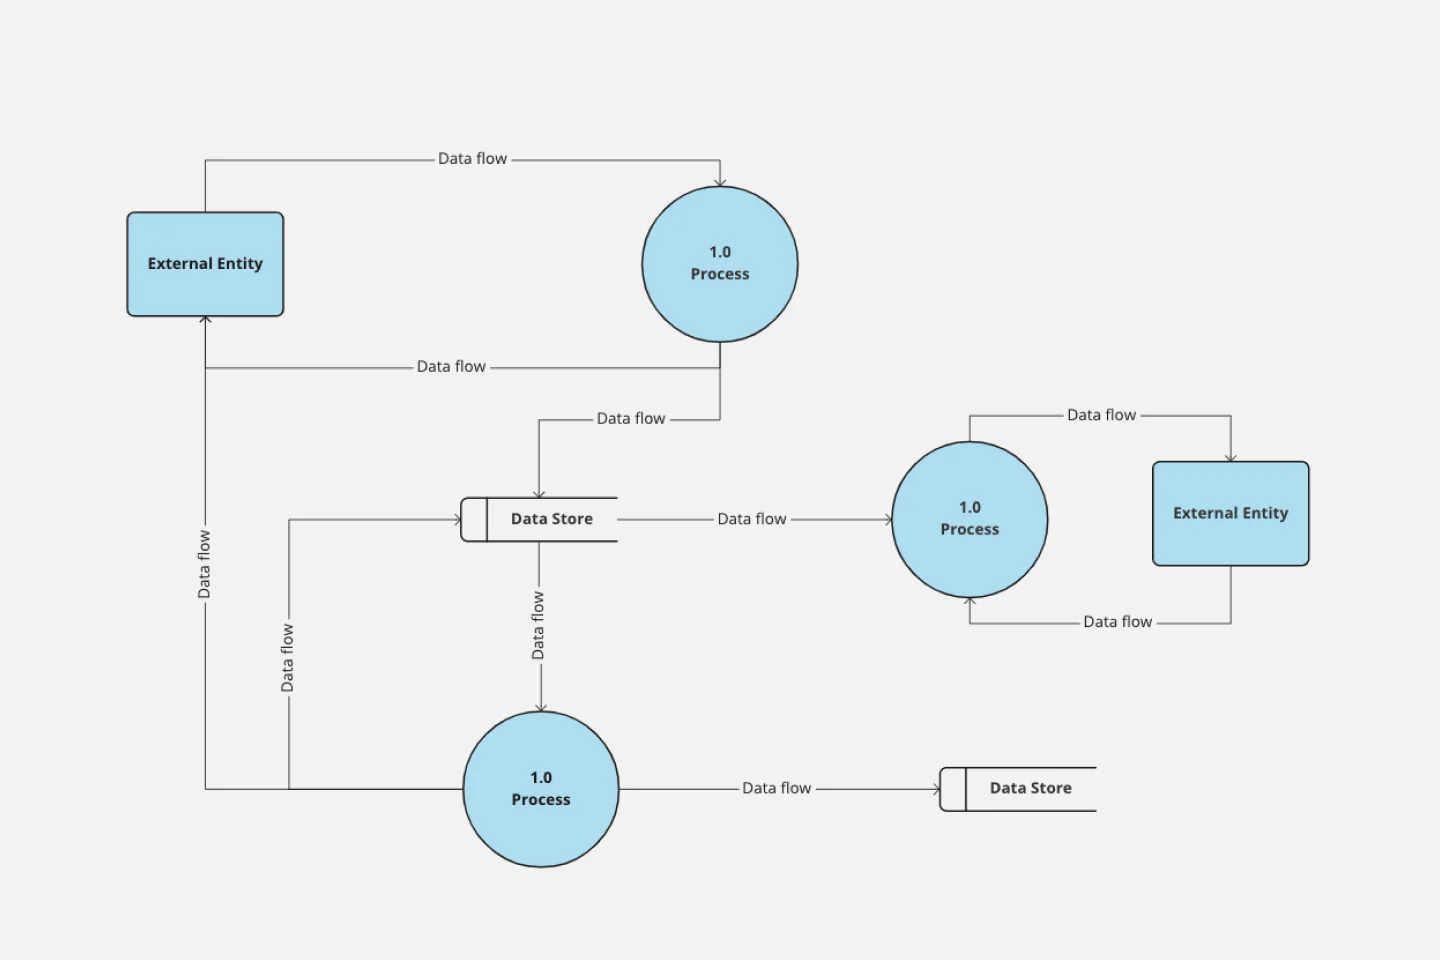
Data Flow Diagram Template
Works best for:
Flowcharts, Software Development, Diagrams
Any process can get pretty complex, especially when it has multiple components. Get a better grasp of your process through a data flow diagram (DFD). DFDs create a simple visual representation of all components in the flow of data and requirements in an entire system. They’re most often used by growth teams, data analysts, and product teams, and they’re created with one of three levels of complexity—0, 1, or 2. This template will help you easily build the best DFD for your process.