Phylogenetic Tree Template
Organize complex data and make it more understandable to everyone with the phylogenetic tree template.
Trusted by 65M+ users and leading companies


About the Phylogenetic Tree Template
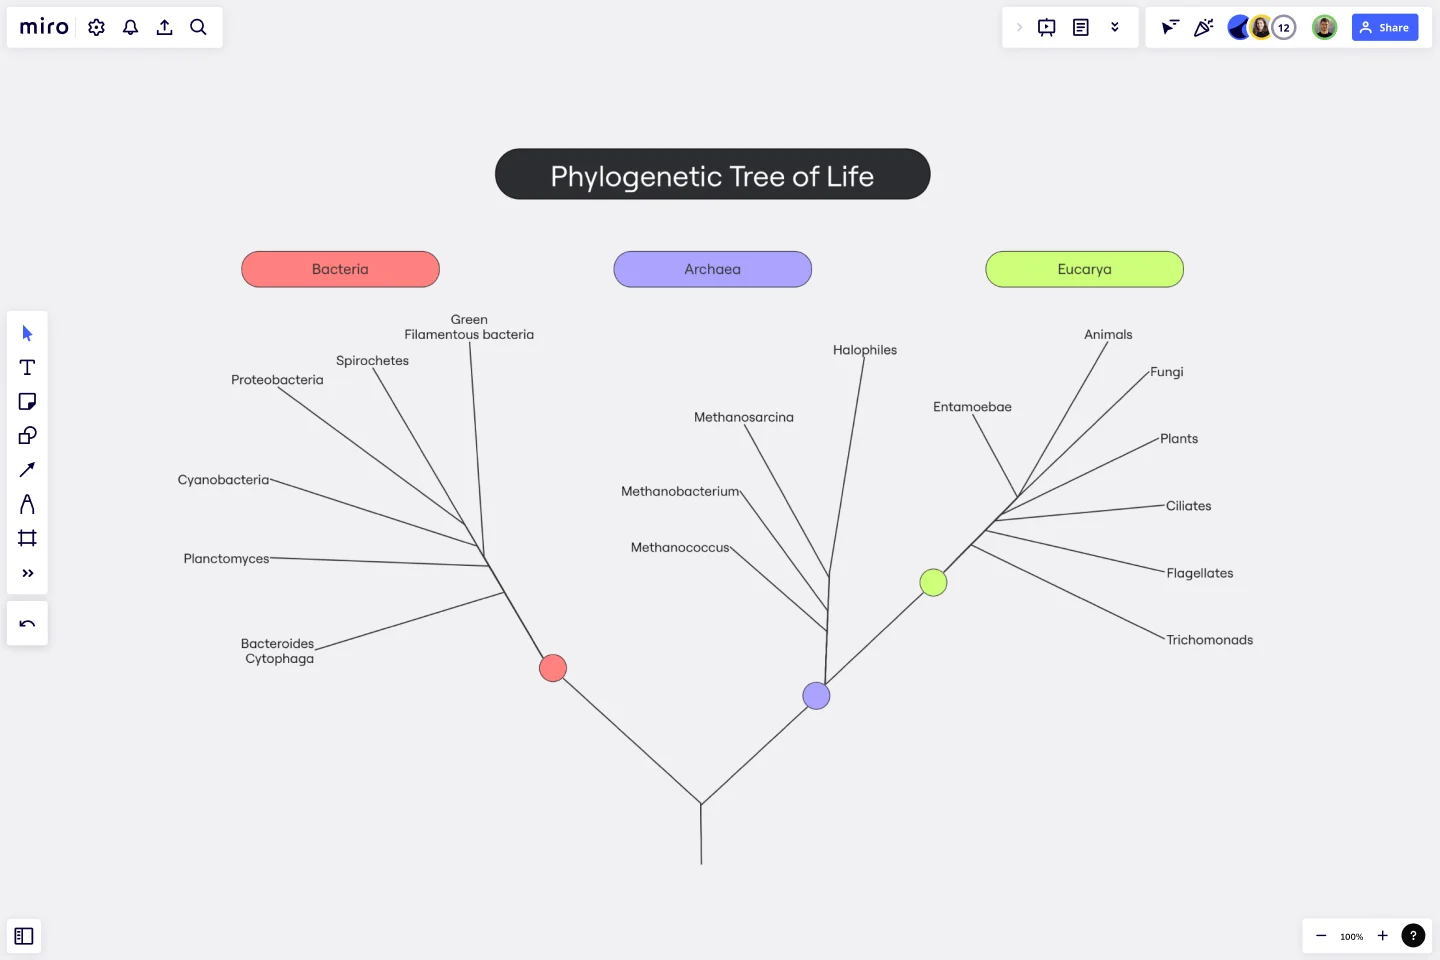
The phylogenetic tree template is an innovative tool for visualizing the evolutionary relationships between species. It is a visual representation of the history of the evolution of life on Earth, and it helps scientists and researchers to identify the relationships between different organisms and their ancestors. This template is a great way to organize complex data and make it more understandable to everyone.
In Miro, the phylogenetic tree template is designed to be simple and easy to use, consisting of different areas representing various aspects of organisms' evolutionary history. These areas include different branches, connector lines, and nodes.
How to use the phylogenetic tree template in Miro
Using the phylogenetic tree template in Miro is very easy. Here are the steps:
Start by adding your data to the template, anything from taxonomic names to DNA sequences.
Use the automated diagramming features to expand the template with more branches and connector lines.
Add any artifact to the Miro board to give more context to your data.
Why should you use the phylogenetic tree?
The phylogenetic tree template offers many benefits to researchers and scientists in biology. Here are some of its key advantages:
Visualizes complex data clearly and concisely, making it easier to comprehend.
It provides an efficient way to organize data and information, enabling easy access and analysis.
It helps identify the relationships between different organisms and their ancestors, leading to important discoveries and insights.
Useful for teaching and learning, providing a visual representation of complex topics and concepts.
Allows for collaboration between researchers and scientists, facilitating the sharing and analysis of data and leading to breakthroughs in the field of biology.
Overall, the phylogenetic tree template is a highly effective tool that has proven invaluable in studying evolutionary biology. Explore all features of Miro's phylogenetic tree maker and start diagramming right now.
Can I personalize the template according to my requirements?
Yes, the template is fully customizable, and you can easily change it with just a few clicks.
Can I expand the template with more branches and connector lines to accommodate my data?
Yes, you can increase the template size with automated diagramming features that allow you to add more branches and connector lines.
Can I add artifacts to the Miro board to provide more context?
Yes, you can add any artifacts to the Miro board to give more context to your data. Simply drag and drop files onto your board.
Get started with this template right now.
Flow Diagrams
Works best for:
Diagramming
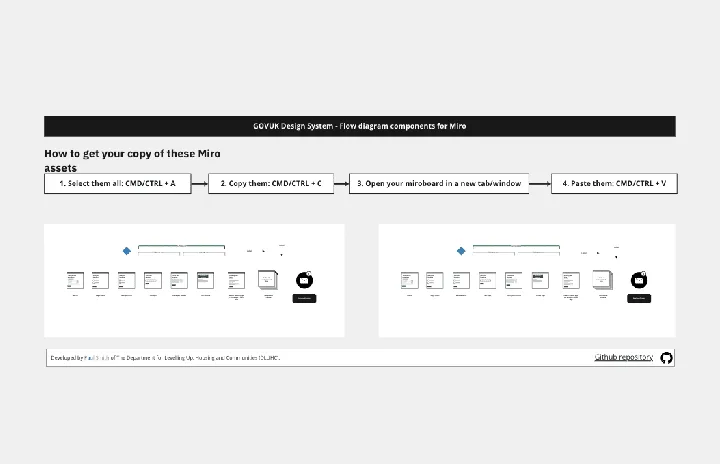
The Flow Diagrams template offers a versatile tool for visualizing processes, workflows, and systems. It provides a range of shapes and connectors for creating flowcharts, process maps, and data flow diagrams. This template enables teams to represent complex systems and processes in a clear and structured manner, facilitating communication and decision-making. By promoting visual clarity and understanding, Flow Diagrams empower teams to analyze and optimize processes effectively, driving efficiency and productivity.

Force Field Analysis Template
Works best for:
Diagramming, Strategic Planning
A Force Field Analysis Template is a powerful tool that helps teams identify and analyze the forces supporting or hindering progress toward a specific change or goal. This template provides a visual space where you can brainstorm and plot out 'driving forces' that push objectives forward and 'restraining forces' that prevent advancement, all on a single, intuitive board. One of the primary benefits of utilizing the Force Field Analysis template is that it fosters a shared understanding among team members. By visually mapping out and discussing each force, teams can prioritize efforts, build consensus on the central issues to tackle, and collaboratively devise strategic plans to strengthen positive influences while reducing negative ones.
Project Organizational Chart Template
Works best for:
Project Management, Documentation, Org Charts
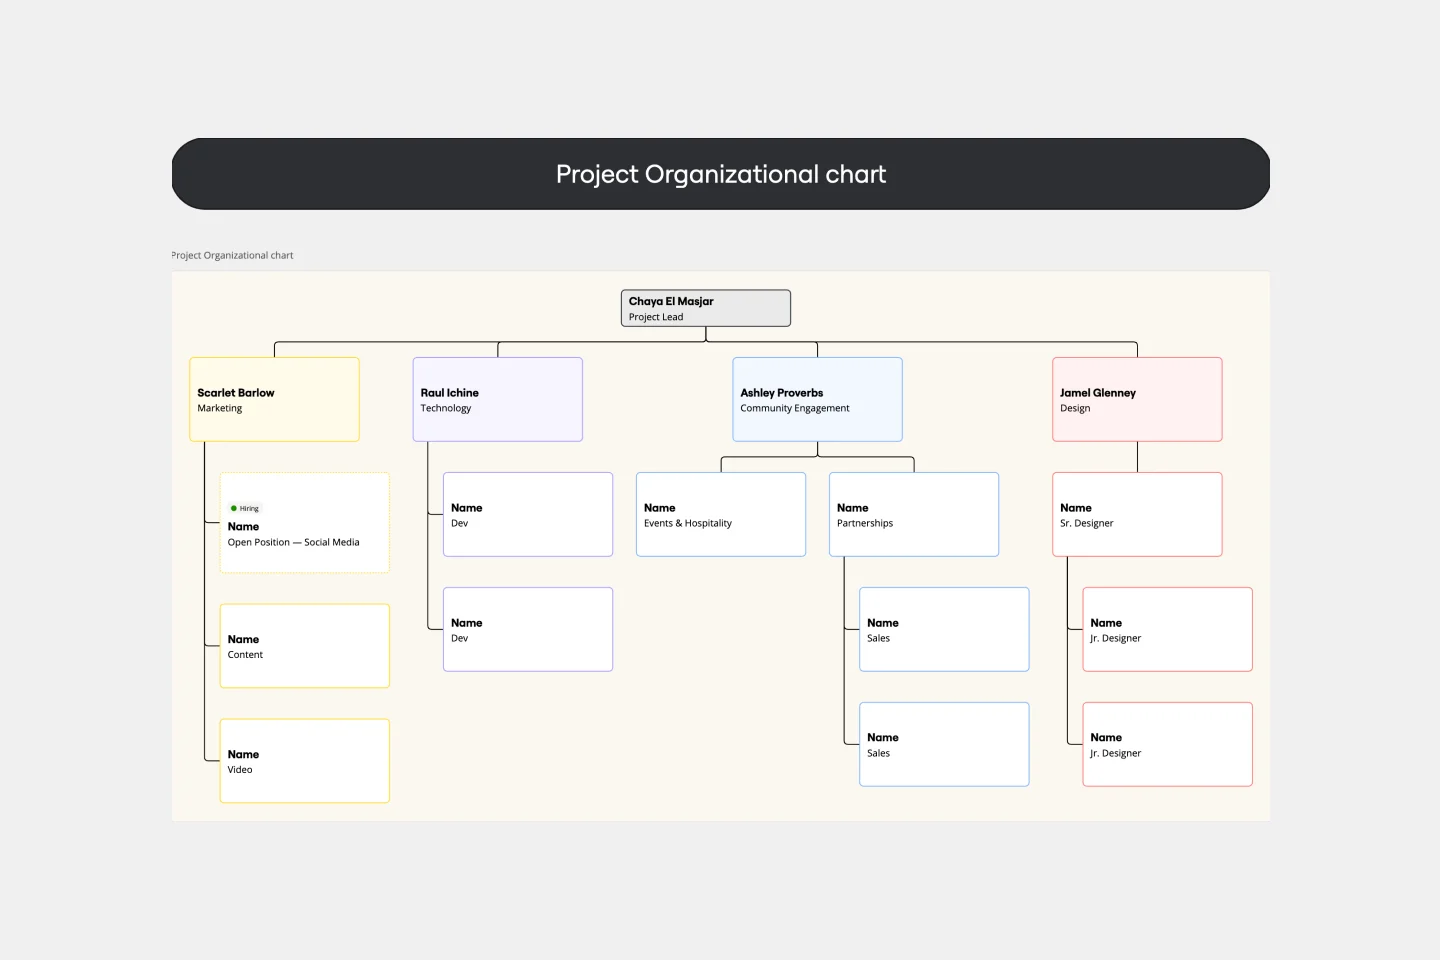
When you’re embarking on a long, complex project, you will inevitably hit roadblocks and obstacles. It’s important to have your project organizational chart on hand to overcome those challenges. A project organizational chart is a visual diagram that illustrates who is on your team and the role they play in a given project. It documents the structure of the project organization, the hierarchy between team members, and the relationships between employees. Project organizational charts are useful tools for clarifying who does what, securing buy-in, and setting expectations for the group.
Argument Map
Works best for:
Diagramming
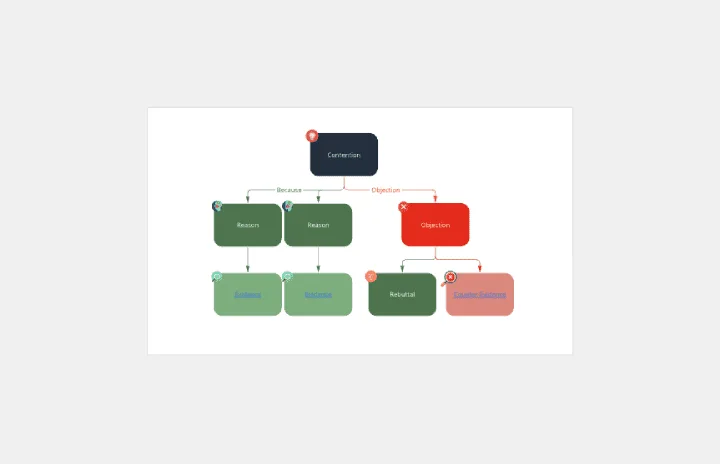
The Argument Map template is a visual tool for structuring and analyzing arguments and debates. It provides a structured framework for capturing premises, conclusions, and logical relationships. This template enables teams to explore complex issues, identify strengths and weaknesses in arguments, and make informed decisions. By promoting clarity and critical thinking, the Argument Map template empowers teams to navigate debates and discussions effectively, fostering consensus and understanding.

20/80 Process Diagram - EOS Compatible
Works best for:
Diagramming
The 20/80 Process Diagram - EOS® Compatible template is a visual tool for mapping out processes and workflows aligned with the Entrepreneurial Operating System (EOS®) methodology. It provides a structured framework for identifying core processes and key activities that drive business outcomes. This template enables organizations to streamline operations, clarify roles and responsibilities, and enhance accountability. By promoting alignment with EOS® principles, the 20/80 Process Diagram empowers teams to achieve organizational excellence and drive sustainable growth.