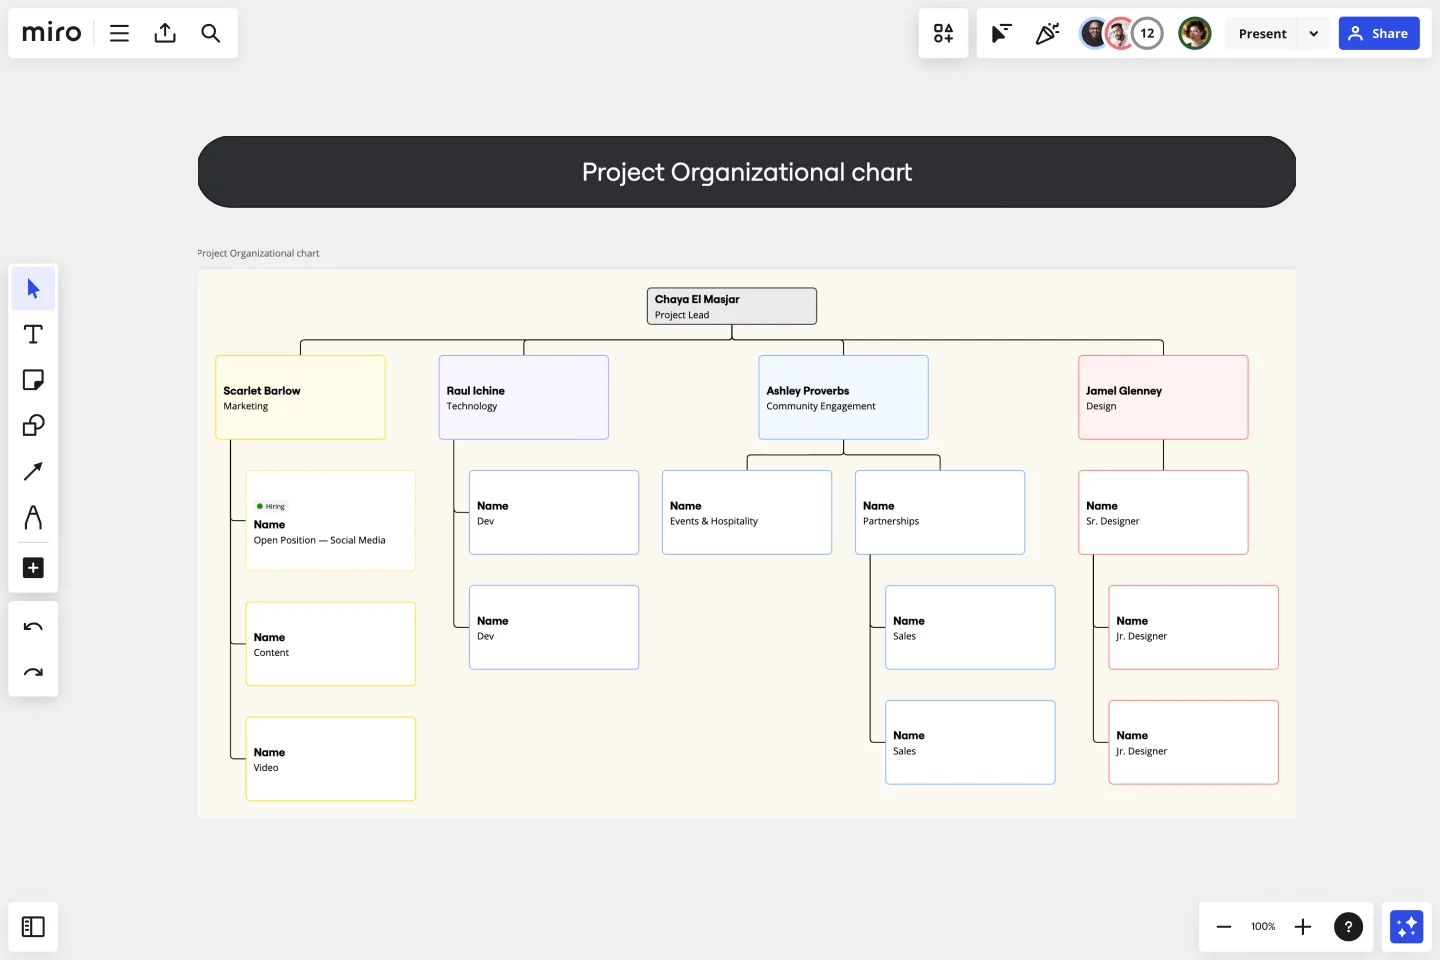
Project Organizational Chart Template
Use the project organizational chart template to structure the personnel on your upcoming project.
Trusted by 65M+ users and leading companies


About the Project Organizational Chart Template
Miro’s project organizational chart template is a visual tool business owners and project managers can use to identify all the people involved in an upcoming project. By referring to the project organization chart, anyone can see each person’s role, the hierarchy among personnel, and the chain of command. When effectively mapped, a project organization chart is a great resource for aligning expectations on responsibilities among all the people involved in a project.
We’ll walk you through how to use Miro’s free project organizational chart template and customize it to your liking.
How to use the project organization chart template
Now that we know what a project organization chart is and why they’re helpful, let’s look at how to create one. Here are a few steps you can take to get started with Miro’s project organizational template:
1. Open Miro’s project organizational chart template
Click on the blue “use template” button on this page to open the template in Miro. Once you’re in, invite any teammates you’d like to collaborate on your project organization chart with.
2. Identify the people who will be involved
Identify who will be involved in your project. Not sure where to start? It’s worth assembling a senior management team and project coordinators.
Your senior management team comprises stakeholders — people who are interested in the outcome of your project, are invested in its success, and are committed to obtaining your expected outcomes. Project coordinators will synchronize and integrate team activities. They’re responsible for ensuring everyone is on task and working toward the goal.
3. Name people on the chart
The project organizational template comes with pre-made rounded rectangles where you can name different people involved in the project. Double-click on the text boxes within them to replace the pre-written names with your teammates’s names. Add their roles and any other important details you’d like to include, such as their email addresses. Duplicate or remove any shapes and connection lines as needed.
4. Customize your project organization chart
Miro makes it easy to customize the look and feel of your project organization chart. Change the sizes and colors of your shapes and text. Drag and drop any of your own files you’d like to include on your Miro board, such as headshots of each team member or important documents for the project.
Why use a project organizational chart
When you’re embarking on a long and complex project, you’ll inevitably hit roadblocks. Your project organization chart can help you overcome those challenges. Let’s look at this (and a few other benefits) in more detail.
Identify roadblocks
Use the chart to identify any project roadblocks before things get underway. That way, you can rectify problems before it’s too late. For example, laying out the chart might show that you need more salespeople involved in the project. Because things haven’t started yet, you have time to get more salespeople involved to ensure the project runs smoothly.
Clarify everyone's role in the project
A project organization chart helps employees understand their role in the project. It shows them the reporting structure and who to communicate with if they need specific tools or resources. You can also supplement your project organizational chart with a team charter to help articulate your team’s mission, scope of operation, objectives, and commitment.
Maximize the skills of all team members
Using an organizational chart for a project makes it clear which team members will be performing certain tasks. This means you can make sure that all tasks are being completed by team members with skills in those areas. For example, you can make sure that a marketing copywriter is writing new website copy.
Miro is the perfect organizational chart maker to help visualize and understand your organization's hierarchical structure and reporting lines between roles.
Do I need a template to make a project organization chart?
It’s not vital, but using a template will likely save you time and maintain consistency across your charts. Having all your project personnel laid out in a hierarchical chart makes it easier to visualize the project. It’ll also bring any gaps to light so you can fill all the roles before going live. For people involved in the project, seeing the chart allows them to see their role in the bigger picture. It also shows them who they need to report to and who they should turn to if they have questions or concerns.
How do you structure a project management team?
First, define your project objectives. Knowing the overall goal will help you create a relevant project management team. Now, select the team members best suited to help you reach these objectives. You’ll then create the organizational structure based on the hierarchical relationships in the company and the project.
What can you do with a project organization chart?
A project organization chart can help with resource management, planning stakeholder communication, and allocating roles and responsibilities. Creating one can also be the first step in forming a detailed organizational breakdown.
Who to include in your project organization chart?
You should include anyone in the core team structure who’s working on the project, including the project manager, the project sponsor, major stakeholders, and individual contributors.
Get started with this template right now.
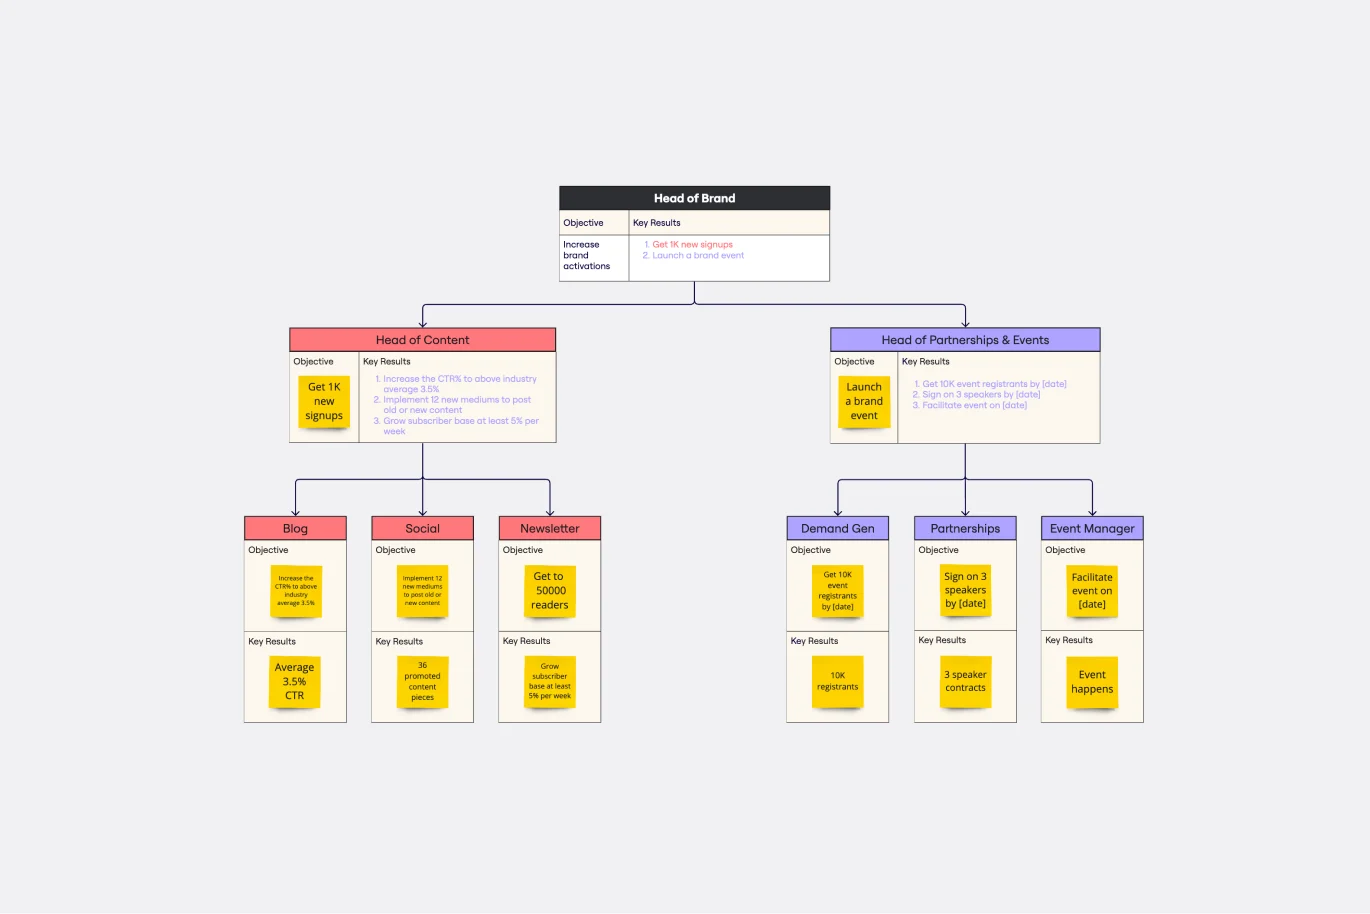
Objectives and Key Results (OKRs) Template
Works best for:
Leadership, Strategic Planning, Project Planning
Clarity, focus, and structure — those are the key ingredients to feeling confident in your company’s directions and decisions, and an OKR framework is designed to give them to you. Working on two main levels — strategic and operational — OKRs (short for objectives and key results) help an organization’s leaders determine the strategic objectives and define quarterly key results, which are then connected to initiatives. That’s how OKRs empower teams to focus on solving the most pressing organizational problems they face.
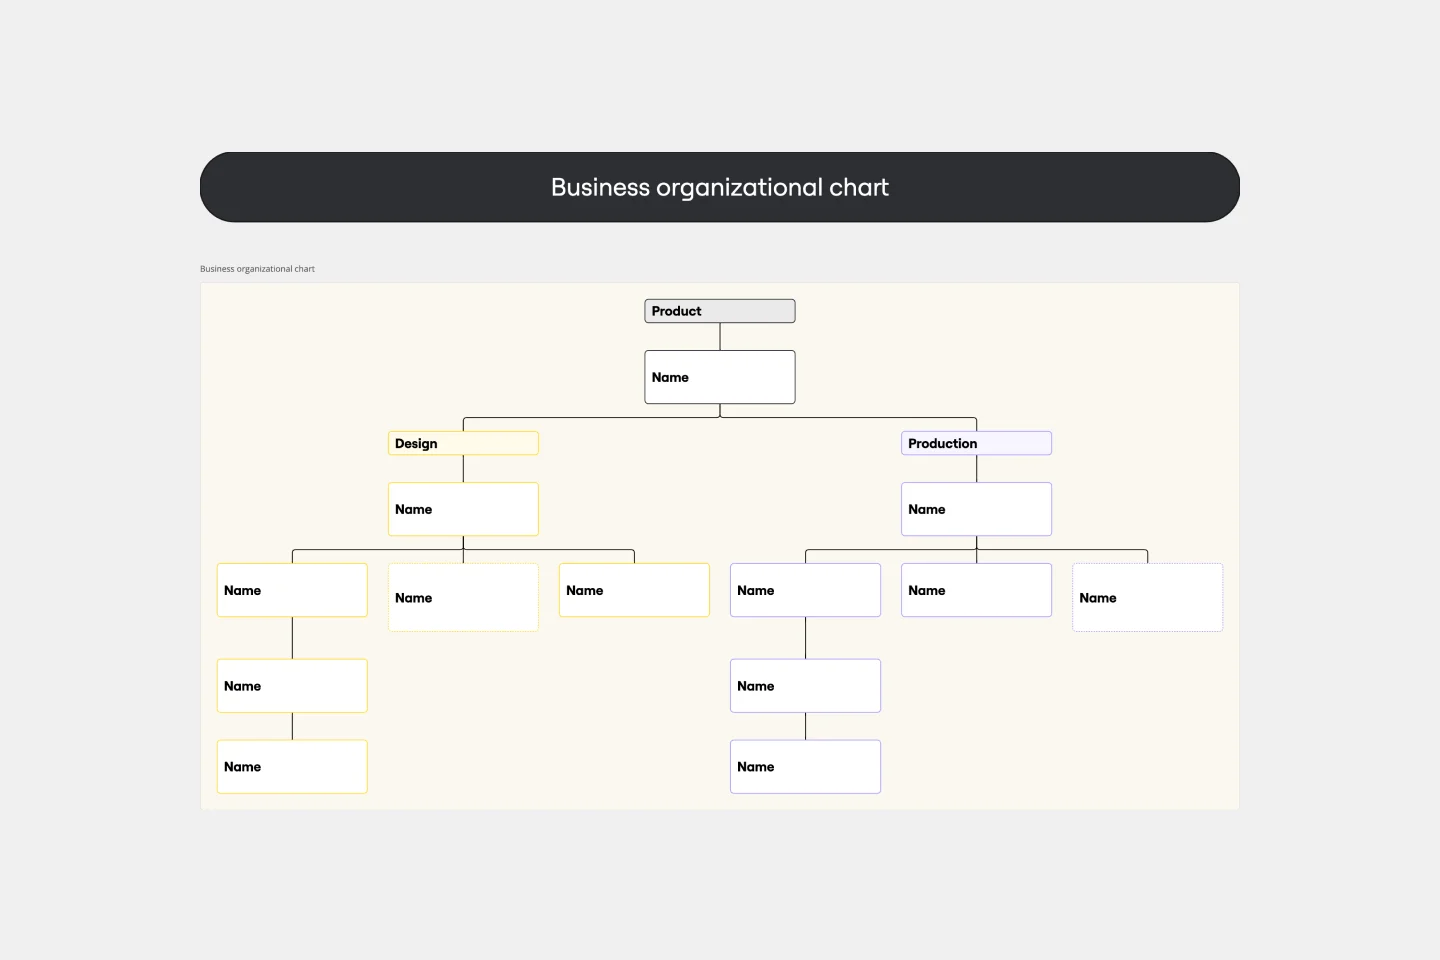
Business Organizational Chart Template
Works best for:
Leadership, Org Charts, Operations
Establishing hierarchy in a business can empower employees—to know their roles and responsibilities, team members, potential cross-functional collaborators, and who to turn to with a specific need. That’s just what a Business Organizational Chart does. And this template makes it simple to build a BOC for your company. The first step is to determine the high-level organizational structure of your company. Then it's easy to create a visual representation of how different employees are interconnected.
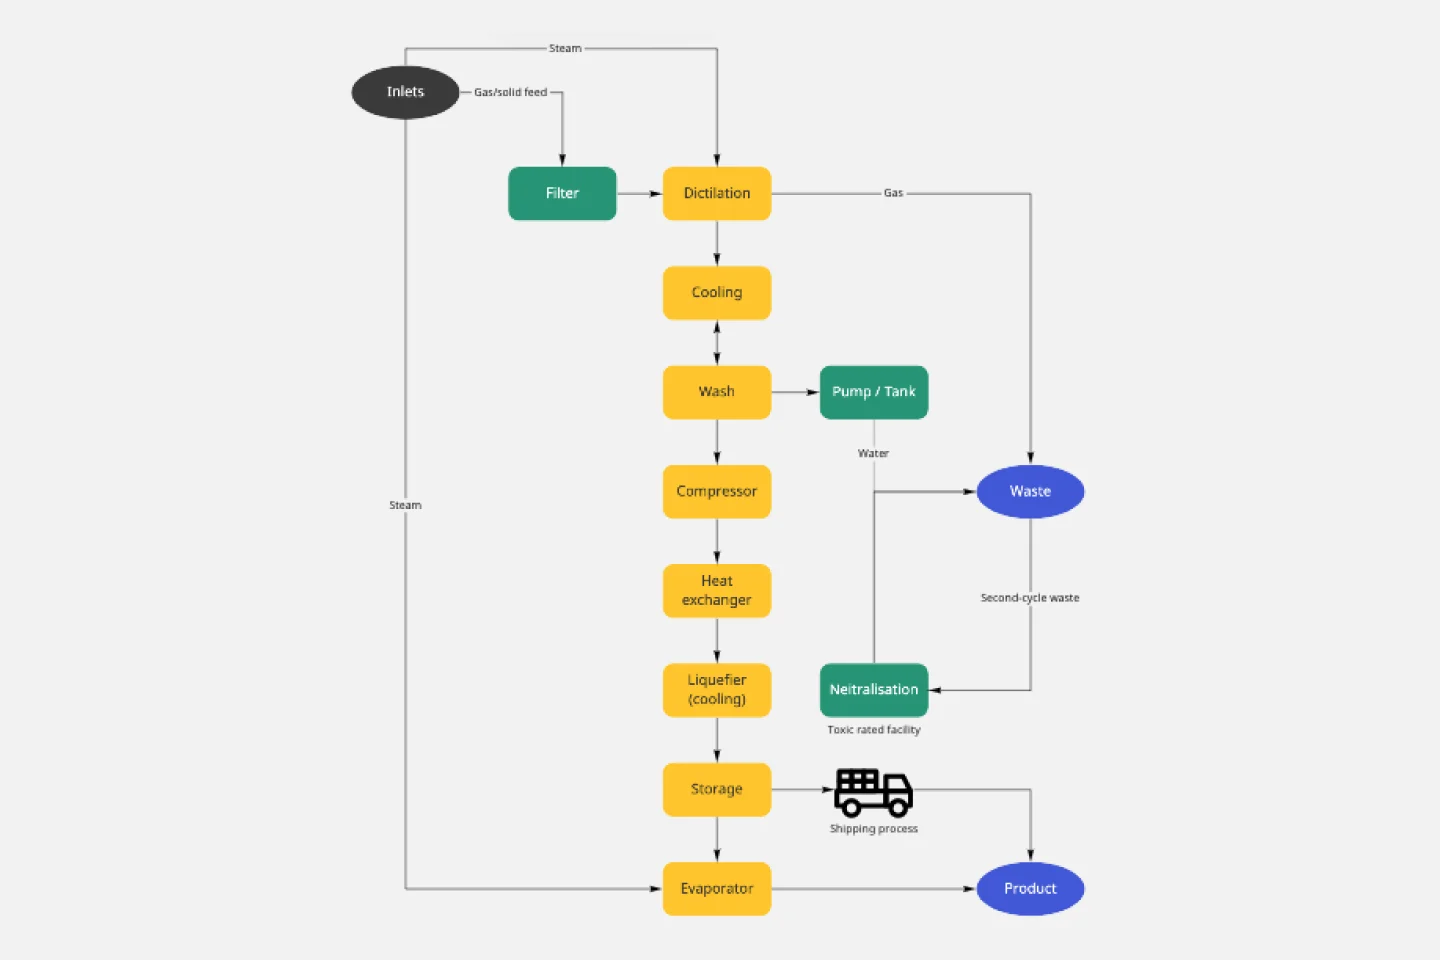
Block Diagram Template
Works best for:
Mapping, Software Development, Diagrams
Use this template to illustrate technical systems. Blocks represent important objects in the system, and arrows demonstrate how the objects relate to each other. Perfect for engineers, workflow managers, or anyone trying to build a better process.
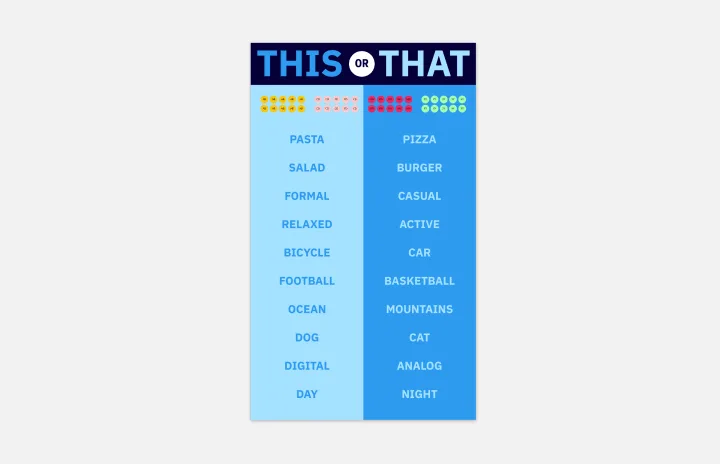
This or That Template
Works best for:
Marketing, Meetings, Workshops
If you’re a social media manager, a designer, or just someone who loves photography, then you’ve probably seen the “This or That” game on Instagram. The premise is simple: You make two parallel lists that pit a series of choices against each other, like “apples or oranges” or “pizza or hot dogs”. The Instagram user chooses between the various options by circling the one that they prefer. Then they share the completed game with their followers. Although it was popularized on Instagram, you can use This or That on other social media platforms too, or even your website or blog.
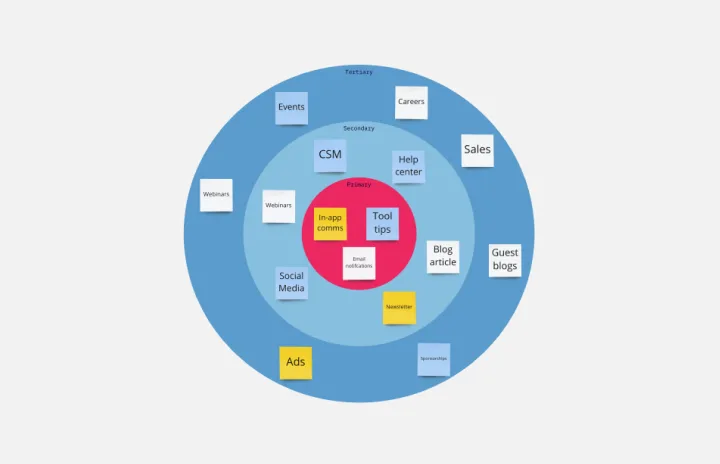
Bull's Eye Diagram Template
Works best for:
Diagrams, Project Management, Prioritization
When you’re a growing organization, every decision can feel like it has make-or-break consequences—which can lead to decision paralysis, an inability to prioritize, inefficient meetings, and even low morale. If that sounds like you, put a Bull’s Eye Diagram to work. True to its name, a Bull’s Eye Diagram uses a model of concentric circles to help companies establish priorities, make critical decisions, or discuss how to remove or overcome obstacles.
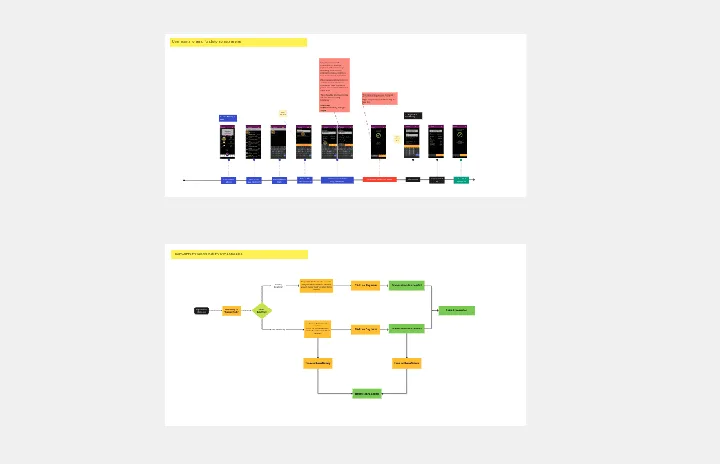
Bank Mobile App User Journey
Works best for:
Diagramming
The Bank Mobile App User Journey template offers a visual framework for mapping out the user experience journey within a banking mobile application. It provides elements for visualizing user interactions, touchpoints, and emotions throughout the journey. This template enables teams to understand user needs, pain points, and opportunities for improvement, facilitating the design of user-friendly and intuitive banking apps. By promoting empathy and user-centric design, the Bank Mobile App User Journey template empowers teams to create digital experiences that meet customer expectations and drive engagement.