UML State Machine Diagram Template
Visualize the different stages of an object or system using a UML state machine diagram template.
Trusted by 65M+ users and leading companies


About the UML State Machine Diagram Template
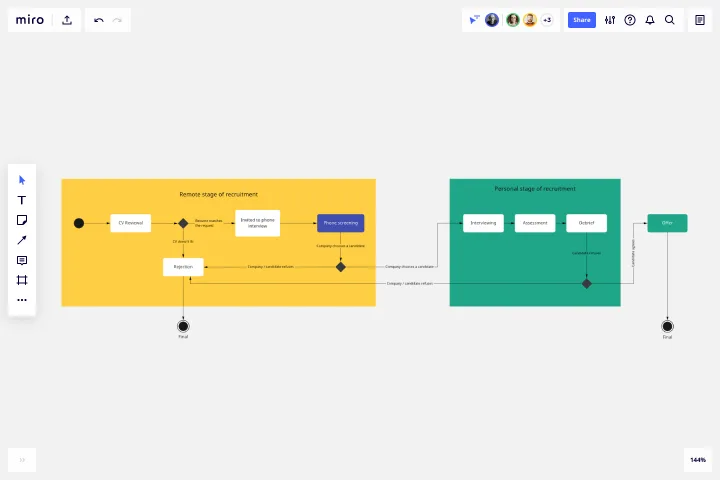
Miro’s UML state machine diagram template is a visual tool you can use to illustrate an object or system’s various states and how it transitions from one to another. State machine diagrams are especially useful for software engineers and system architects looking to understand, design, and communicate complex state transitions and interactions — such as seeing how a web service responds to different requests.
In the next section, we’ll walk you through how to use the UML state machine diagram template.
How to use the UML state machine diagram template
To get started, click on the “use template” button to open the UML state machine diagram template in Miro. Once you’re in, follow these steps to start filling it in:
1. Define states and objects
Define your possible states and the objects that belong to them. Use the shapes in the template to represent each state by double-clicking on the text boxes to edit them.
For example, if you’re creating a behavioral state machine diagram for an elevator system, you could define the states as 'Not activated,' 'Waiting for user input,' and 'Moving up' or ‘Moving down.’
2. Connect states to objects
Once you’ve defined your states, connect them with the correct objects. For example, for a UML state machine diagram representing an elevator system, you’d connect the ‘Move Up’ object to the 'moving up' state and the ‘Move Down’ object to the 'moving down' state.
Use the arrows in the state machine diagram template to link states and objects. Rearrange, duplicate, and remove them as needed.
3. Add transition actions and conditions
Once you connect the states with the objects, fill in the appropriate actions for each state. For example, if your elevator diagram has a state called 'waiting for user input,’ instruct the user on what they should do next. Double-click on the text boxes you want to edit to replace them with your own actions and outcomes.
4. Define guard conditions
Finally, add guard conditions or actions that would trigger your transitions. For example, if an elevator is moving upward and the user presses the 'down' button, this action would trigger the elevator to move back to its 'waiting for user input' state.
In the state machine diagram template, double-click on a textbox along an arrow connecting two states and add the appropriate guard condition.
Miro is also the perfect state diagram maker if you'd prefer to diagram from scratch. Simply use Miro's diagramming tool and UML shape pack.
What is the state machine diagram template for?
A state machine diagram template helps you visualize a software’s different states and how it transitions between them. Take video games, for example. If you’re designing a video game, a state machine diagram will help show how the user will move through the different stages of playing.
Can I build a state machine diagram from scratch?
Absolutely. Miro makes it easy to build a state machine diagram from scratch using our automated diagramming and mapping tools and user-friendly interface. Drag and drop the shapes you need onto your canvas, add connection lines to depict transitions, and use text boxes to add labels.
Does Miro have a free UML diagramming shape pack?
Miro offers plenty of free shape packs to equip you with all the diagramming tools you need — though you’ll need a Business, Enterprise, or Education plan to access our UML shape pack.
Get started with this template right now.
Interrelationship Diagram
Works best for:
Diagramming
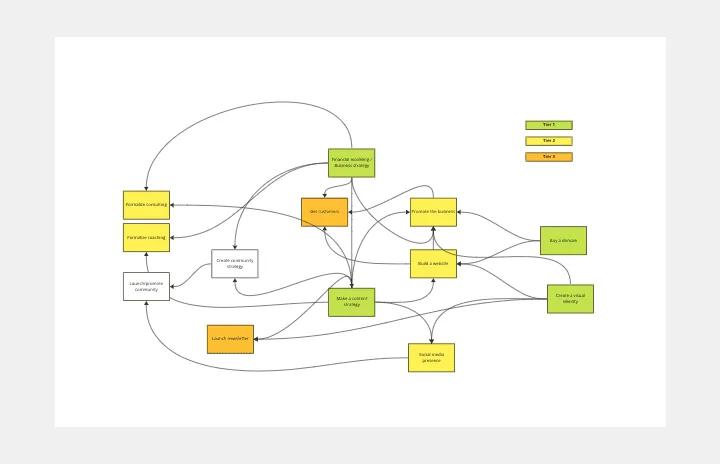
The Interrelationship Diagram template is a visual tool for analyzing and illustrating complex relationships between variables or elements within a system. It provides a structured framework for mapping out connections, dependencies, and interactions. This template enables teams to visualize patterns, identify causal relationships, and uncover insights into system behavior. By promoting systems thinking and understanding of interdependencies, the Interrelationship Diagram empowers organizations to make informed decisions and drive effective solutions to complex problems.
PERT Chart Template
Works best for:
Mapping, Project Planning
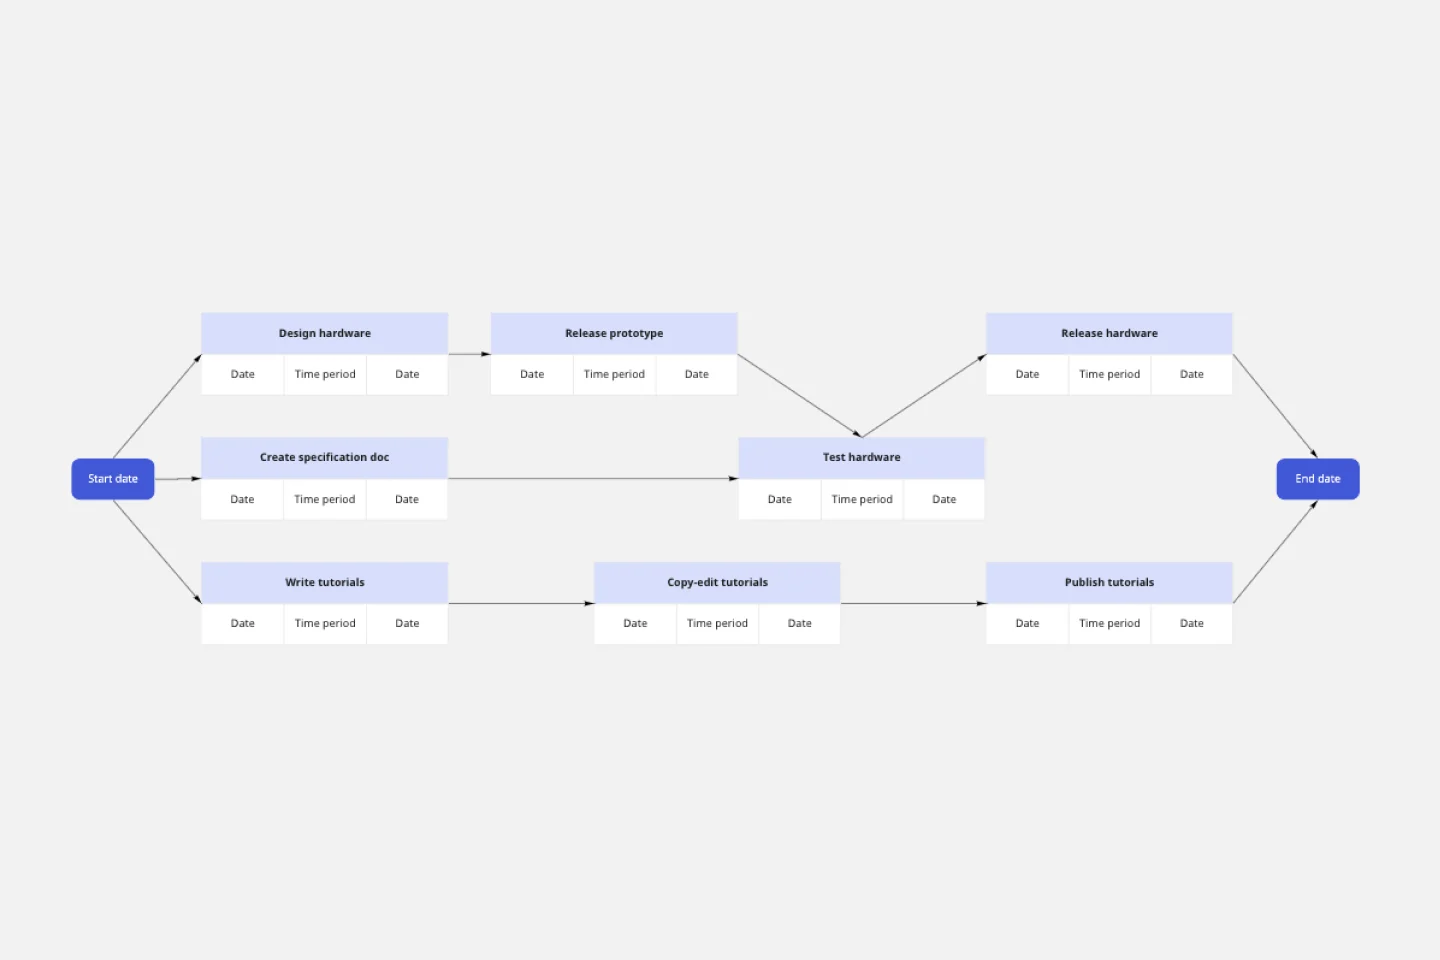
A Program Evaluation and Review Technique (PERT) diagram is used to plan projects efficiently. They help you set a clear timeline, plan out tasks and dependencies, and determine a critical path.
Cynefin Framework Template
Works best for:
Leadership, Decision Making, Prioritization
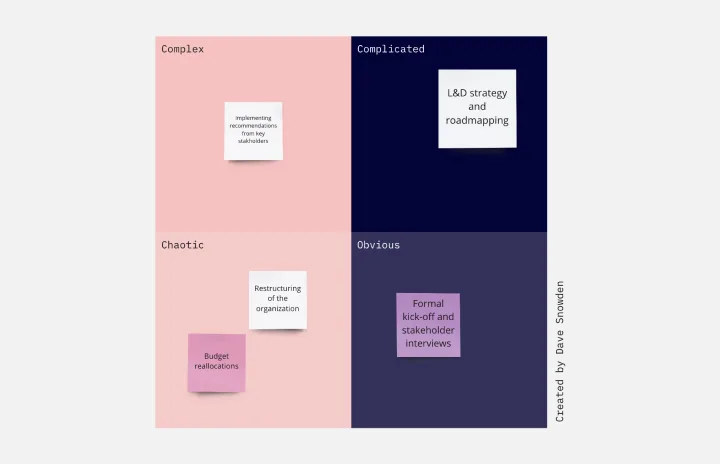
Companies face a range of complex problems. At times, these problems leave the decision makers unsure where to even begin or what questions to ask. The Cynefin Framework, developed by Dave Snowden at IBM in 1999, can help you navigate those problems and find the appropriate response. Many organizations use this powerful, flexible framework to aid them during product development, marketing plans, and organizational strategy, or when faced with a crisis. This template is also ideal for training new hires on how to react to such an event.
AWS Git to S3 Webhooks Template
Works best for:
Software Development, Diagrams
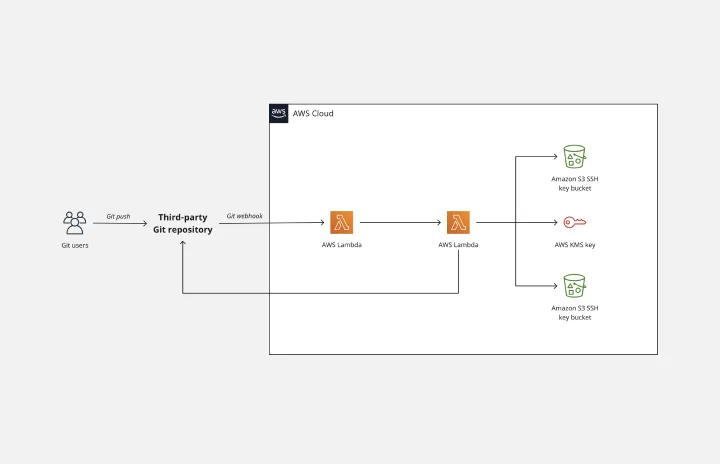
The AWS Git to S3 Webhooks Template is a visual representation of Git webhooks with AWS services Quick Start architecture. You can now have an overview of your AWS architecture with Miro’s AWS Git to S3 Webhooks Template, track your cloud solutions easily, and optimize processes like never before.
UML Sequence Diagram Template
Works best for:
Software Development, Mapping, Diagrams
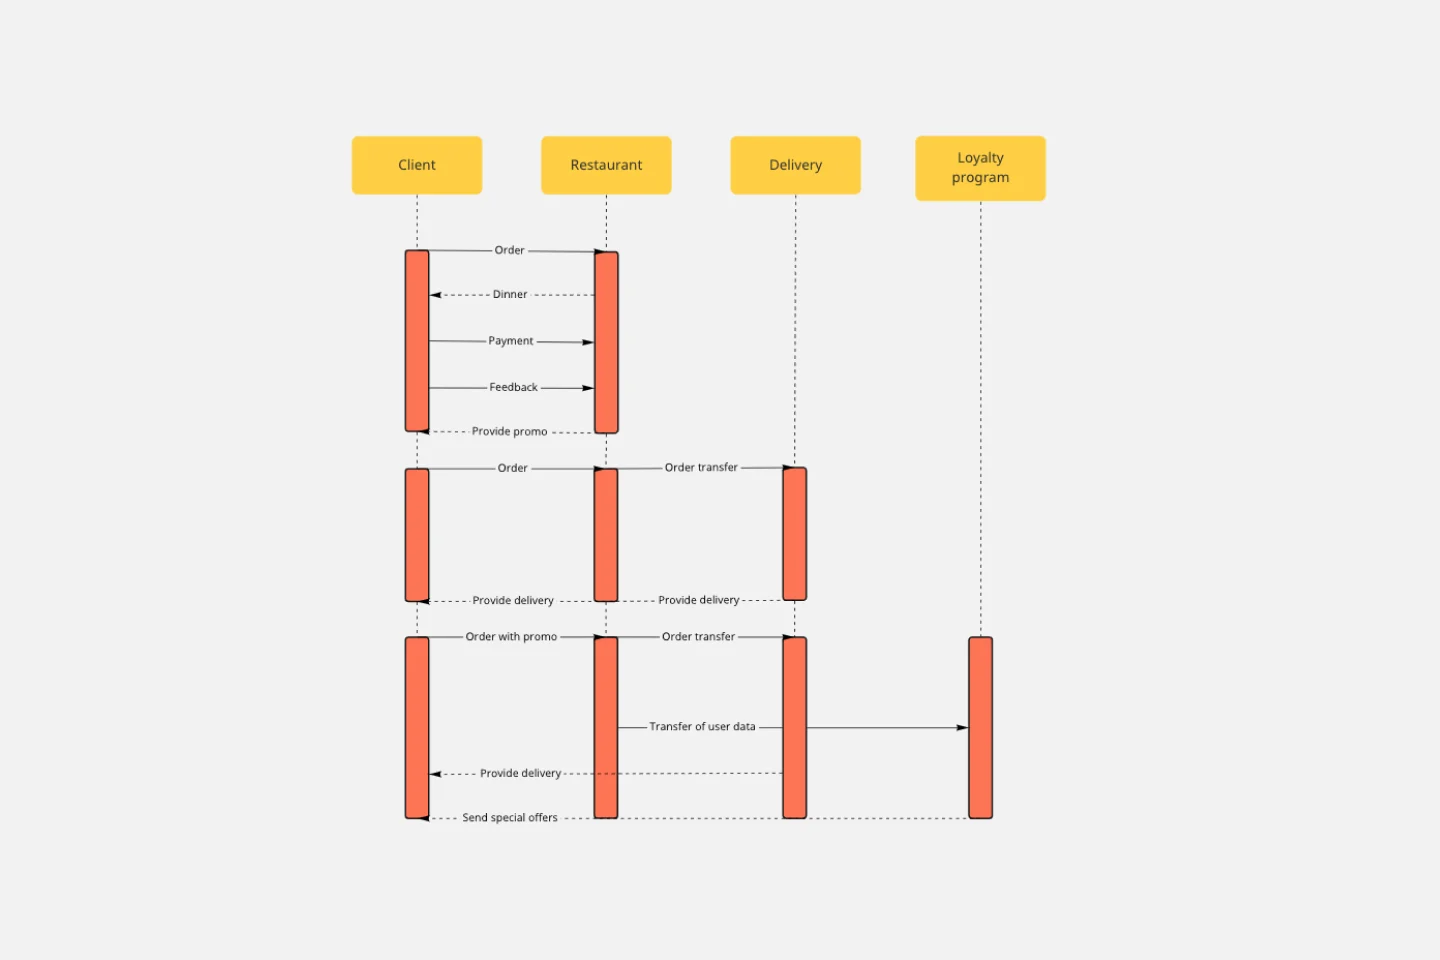
Analyze and showcase how external entities interact with your system using a sequence diagram. Get a bird’s-eye view of your work processes, business functions, and customer interactions using this diagram. Also, identify any potential problems early and solve them before implementation.
Interactive Video Storyboard Canvas
Works best for:
Diagramming
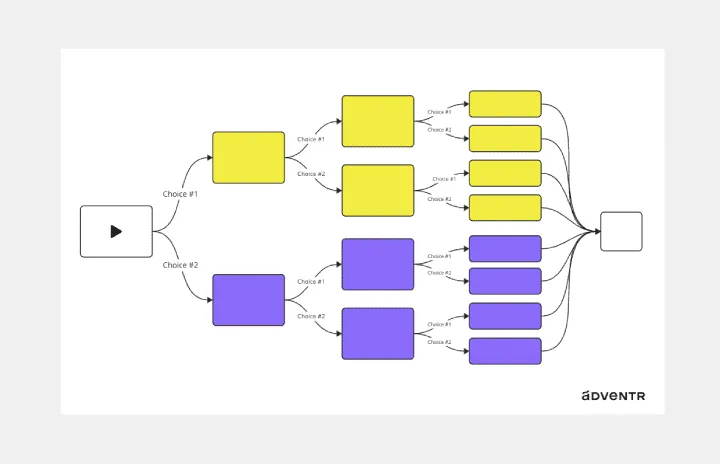
The Interactive Video Storyboard Canvas template offers a visual framework for planning and storyboarding interactive video content. It provides elements for outlining scenes, defining interactions, and visualizing user pathways. This template enables teams to design engaging and immersive video experiences, facilitating collaboration and alignment among content creators and stakeholders. By promoting creativity and interactivity, the Interactive Video Storyboard Canvas empowers teams to create compelling video narratives that captivate audiences and drive engagement.