Genogram Template
More than a family tree, use this genogram template to map out detailed data and hereditary trends. Identify patterns and in-depth family dynamics.
Trusted by 65M+ users and leading companies


About the Genogram Template
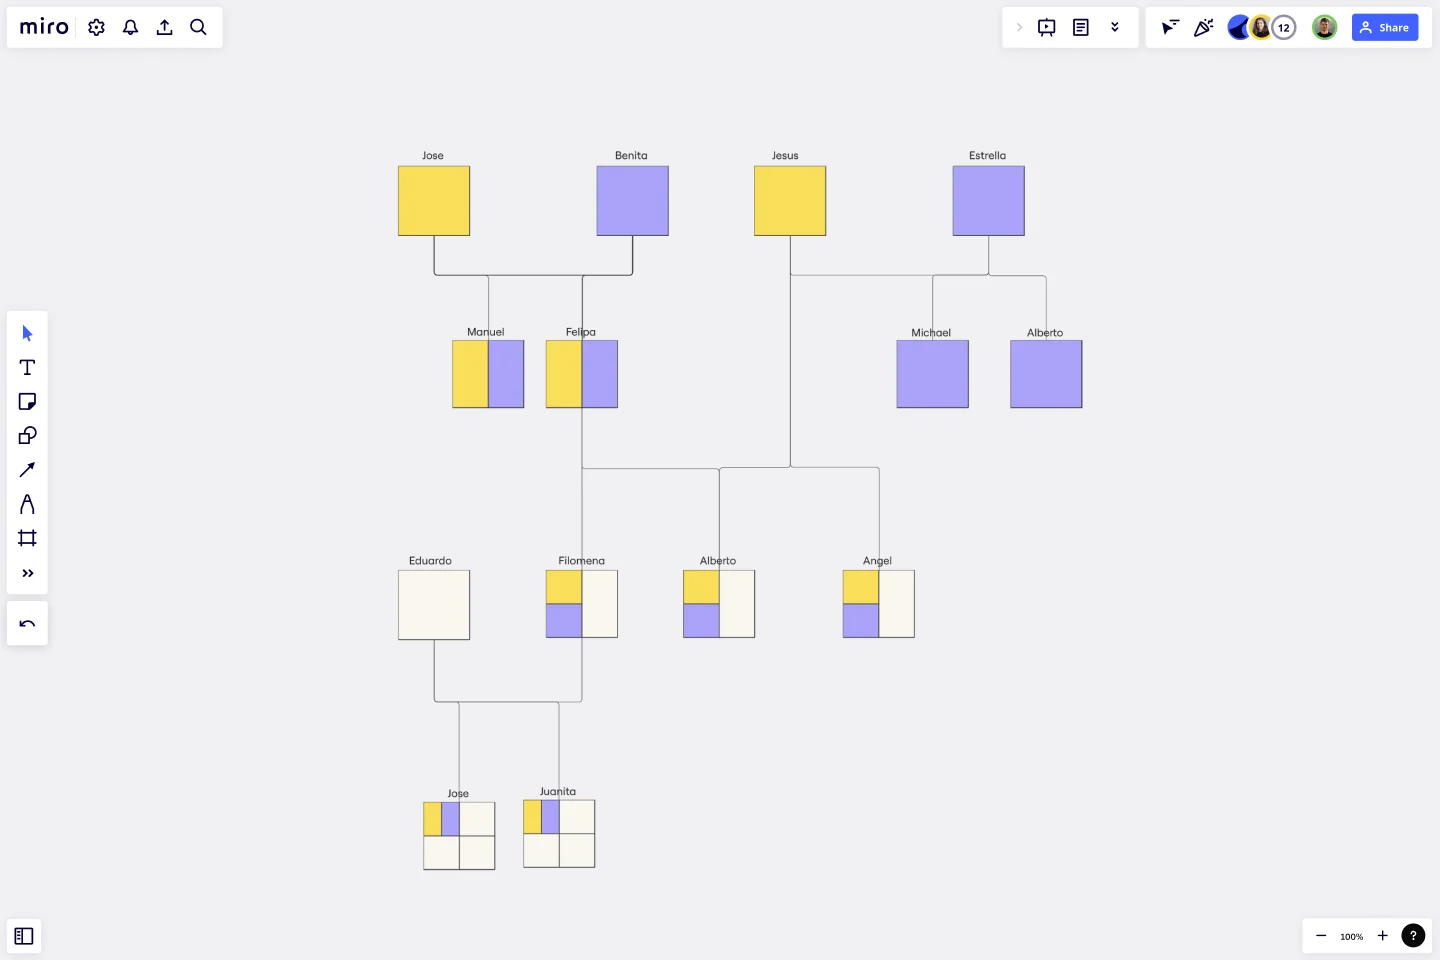
A genogram template is a great tool to illustrate family structures and relationships. Its broad nature helps detail patterns and understand familial connections, making it essential for professionals across different domains.
The template is a graphical representation of a family tree that showcases relationships between members and generations within a family. It goes beyond the traditional family tree by adding more details, including emotional relationships and significant life events. With their visual nature, genograms can briefly represent complex family ties and histories, making it easier to identify behavior patterns and recognize hereditary tendencies.
How to use the genogram template
Filling in the genogram template is a straightforward process. With just a few clicks, elements within the template can be edited to reflect specific familial relationships and dynamics. Names, relationships, and details can easily be added and adjusted.
1. Add symbols
Open the template and use Miro’s extensive shapes library to represent family members. Typically, males are represented by squares and females by circles. Arrange the symbols from left to right, starting with the oldest generation at the top and moving down to the youngest.
2. Draw connections
Build on the template by using lines to connect family members. For instance, a horizontal line between two shapes indicates a marital relationship, while a vertical line dropping down from a couple can connect to their children.
You can indicate other relationships, such as divorces, with different types of lines (e.g., dotted or double lines). Make sure to decide on a legend or key for these symbols and lines.
3. Expand your genogram
Miro’s automated diagramming features make it easy to expand the genogram, accommodating larger families without complicating the design.
4. Embed other materials
Any relevant artifact, whether a photograph, document, or note, can be incorporated onto the board for a more enriched view.
5. Collaborate and share
With Miro as your genogram maker, you can invite others to collaborate if you're working as a team or if you want family members to provide input. Use the sharing options to share your genogram with others or to export it as an image or PDF.
Why should you use a genogram template?
Easy to create and update: By using a template to create a genogram, you can easily customize the diagram and keep it up-to-date.
Deep insights: Unlike basic family trees, genograms delve deeper into the nuances of relationships, offering insights into patterns and trends that may be hereditary or environmental.
Holistic view: By encompassing emotional, medical, and relational aspects, the template provides a comprehensive perspective on familial dynamics.
Adaptable application: Many professionals can benefit from the detailed structure of genograms, from therapists to genealogists to educators.
Efficient communication: The visual format ensures easy interpretation and can be a visual aid for professionals explaining intricate relationships to clients or colleagues.
Problem identification: By visualizing problematic relationships or patterns, interventions or solutions can be more effectively designed and implemented.
What's the difference between a family tree and a genogram?
While both tools represent family structures, a genogram is more detailed, highlighting emotional ties, medical history, and other significant life events.
How detailed should a genogram template be?
The depth of detail largely depends on its intended use. For some, basic relationships suffice, while others may need intricate details for therapeutic or research purposes.
Is there a limit to how large the genogram can be?
The automated diagram feature can expand the template to accommodate large family structures, ensuring clarity and coherence.
Can I collaborate with others on this genogram template?
Yes, collaboration is a built-in feature, allowing multiple contributors to edit, view, and comment in real time, making the process interactive and comprehensive.
Get started with this template right now.
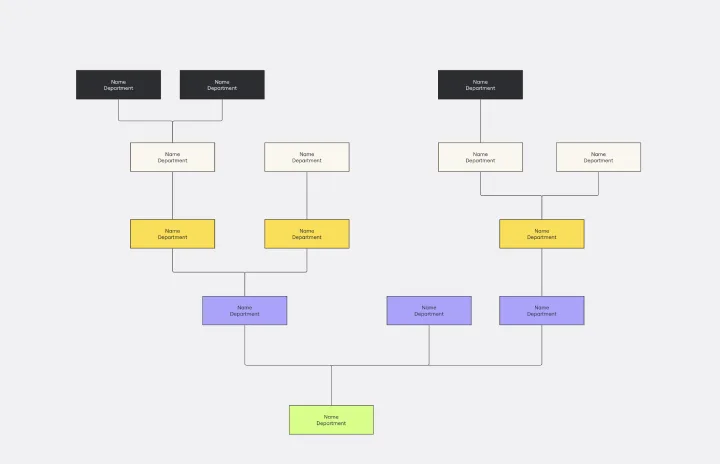
Inverted Org Chart Template
Works best for:
Org Charts, Organizational Design
The Inverted Org Chart Template is a tool that reimagines the traditional hierarchical model by placing frontline employees at the top of the organizational structure. This innovative approach highlights the crucial role played by those who interact with customers directly, ensuring that their insights and contributions are not only recognized but also celebrated. One of the key advantages of this template is that it fosters a feedback-driven environment. Prioritizing frontline workers promotes a culture where valuable insights from the ground can quickly reach the top of the hierarchy, streamlining decision-making processes and ensuring that strategies are based on real-world experiences.
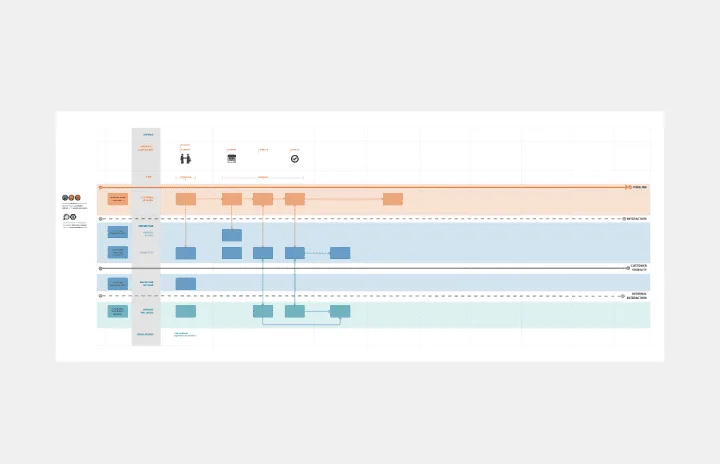
Service Blueprint
Works best for:
Diagramming
The Service Blueprint template is a visual tool for designing and optimizing service experiences. It provides a structured framework for mapping customer journeys, identifying touchpoints, and aligning internal processes. This template enables teams to visualize the entire service ecosystem, uncover pain points, and innovate solutions to enhance customer satisfaction. By promoting customer-centricity and collaboration, the Service Blueprint empowers organizations to deliver exceptional service experiences and drive sustainable growth.
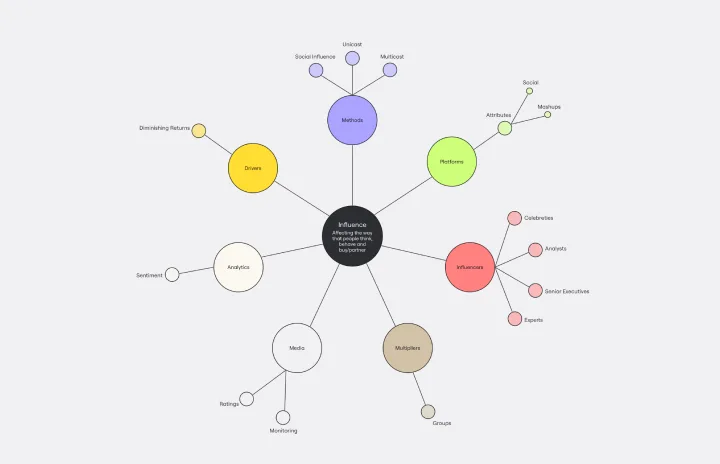
Cluster Diagram Template
Works best for:
Diagramming
The Cluster Diagram Template is a valuable tool for organizing and connecting ideas, concepts, and information in a visually compelling and coherent manner. The template's design centers on grouping related ideas around a core concept, creating a transparent and hierarchical structure. This clustering not only aids in breaking down complex information into manageable segments but also significantly enhances the process of idea generation and brainstorming. A structured yet flexible visual framework encourages deeper engagement and more precise understanding, making it an essential asset for teams and people looking to bring order to their creative and analytical processes. I have checked the text for any potential spelling, grammar, and punctuation errors, and it's good to go.
Interrelationship Diagram
Works best for:
Diagramming
The Interrelationship Diagram template is a visual tool for analyzing and illustrating complex relationships between variables or elements within a system. It provides a structured framework for mapping out connections, dependencies, and interactions. This template enables teams to visualize patterns, identify causal relationships, and uncover insights into system behavior. By promoting systems thinking and understanding of interdependencies, the Interrelationship Diagram empowers organizations to make informed decisions and drive effective solutions to complex problems.
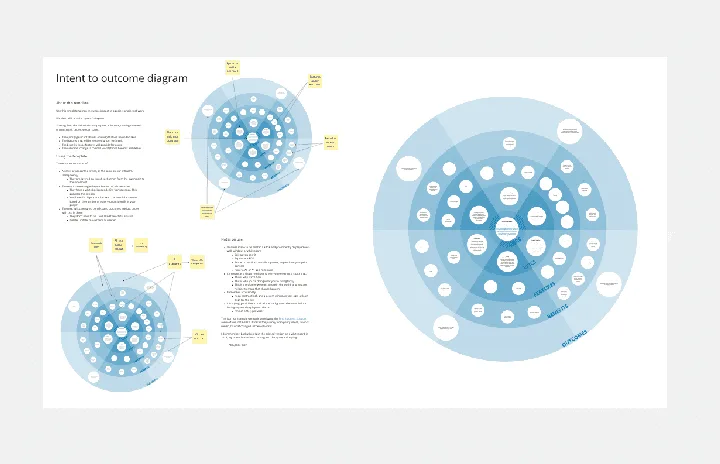
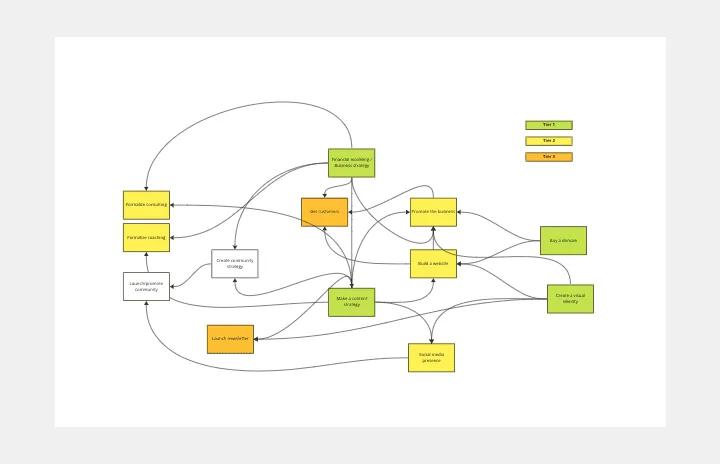
Intent to Outcome Diagram
Works best for:
Diagramming
The Intent to Outcome Diagram template is a visual tool for mapping out the relationship between desired outcomes and the actions required to achieve them. It provides a structured framework for defining intentions, outcomes, and key activities. This template enables teams to align on goals, track progress, and identify areas for improvement. By promoting clarity and alignment, the Intent to Outcome Diagram empowers organizations to set strategic direction and drive results effectively.
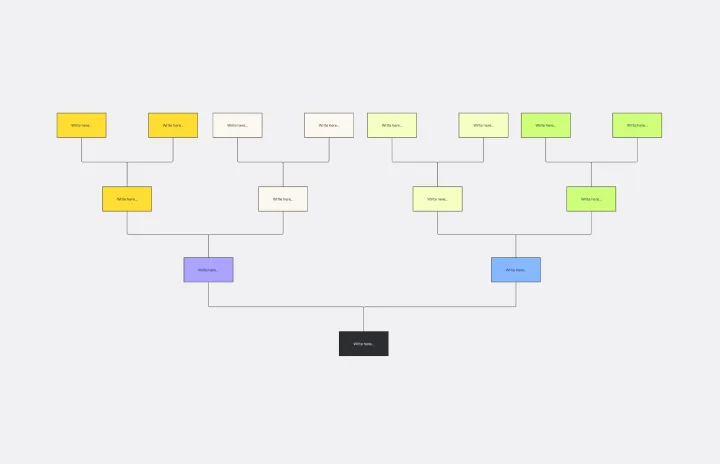
Tree Diagram Template
Works best for:
Diagramming
The tree diagram template helps you organize and present complex information. One of its key benefits is its ability to provide unparalleled visual clarity. It enables you to simplify complicated ideas into a structured, hierarchical format, making it easier to understand and communicate. This template enhances brainstorming sessions, project planning, and decision-making processes by mapping out relationships and dependencies clearly and effortlessly. You can now say goodbye to information overload and immerse yourself in a visual journey that simplifies complexity with the tree diagram template.