Tree Diagram Template
Organize ideas effortlessly, enhance collaboration, and streamline decision-making with the tree diagram template.
Trusted by 65M+ users and leading companies


About the Tree Diagram Template
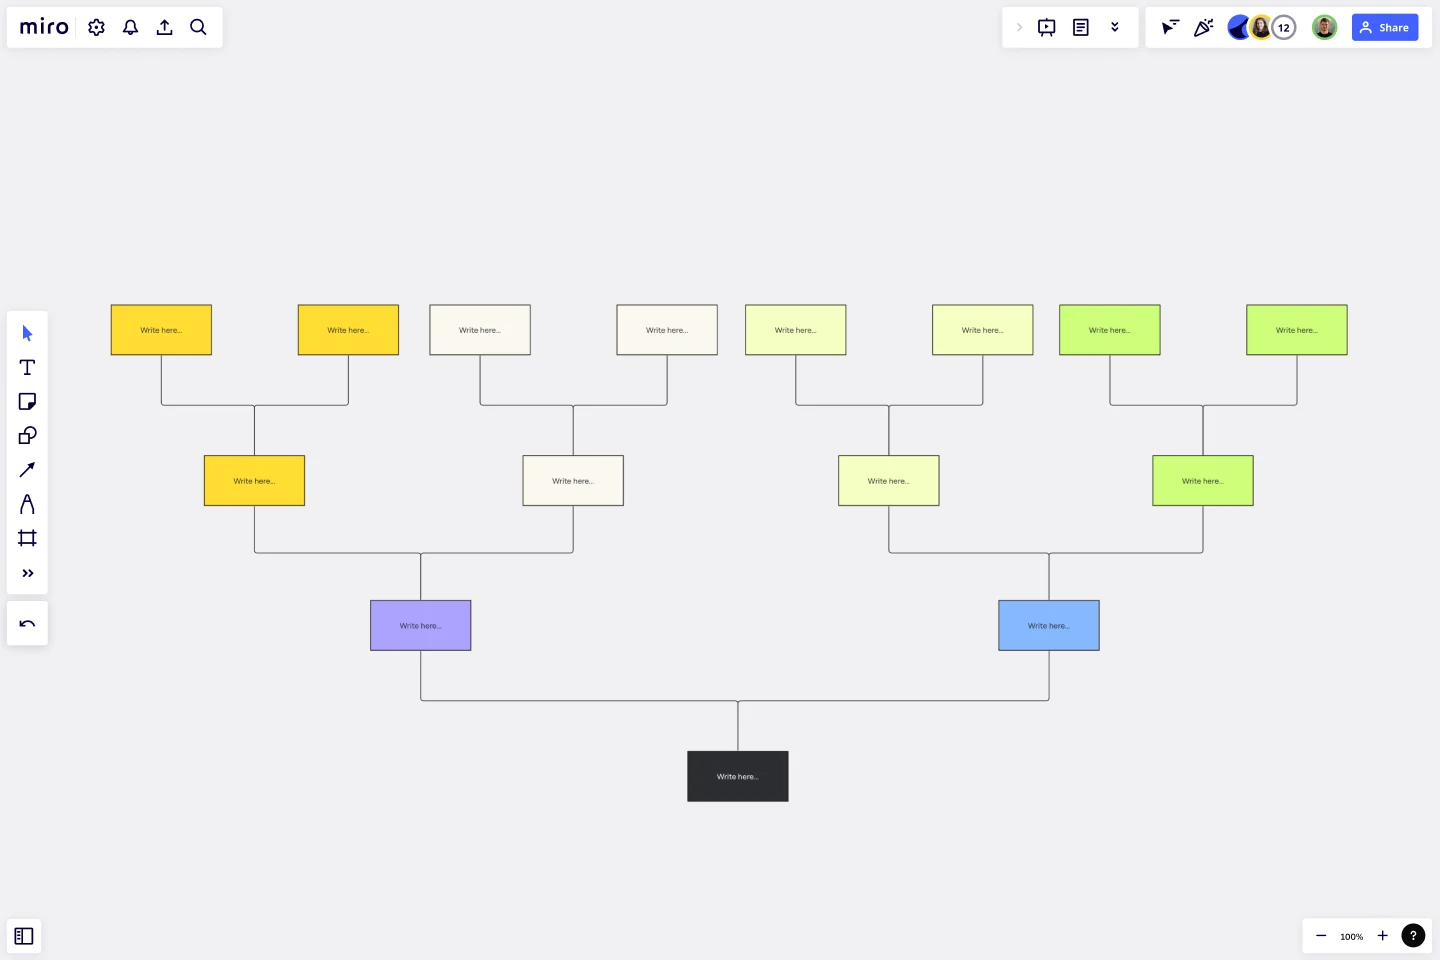
The tree diagram template is an excellent tool for organizing complex ideas and information in a clear, hierarchical structure. Its intuitive design and user-friendly interface provide a visual representation of your thoughts, making it easier to understand and communicate your ideas effectively. Whether you need to break down complex concepts or streamline decision-making processes, this template is your go-to solution. It brings clarity and structure to your ideas, allowing you to map out your thoughts and present them in a tree-like structure.
The template consists of a central node, often representing a main idea or concept, and branches extending outward to depict subcategories or related concepts. Each branch can expand into additional nodes, creating a hierarchical structure that mirrors the relationships between different elements. Users can easily customize each node with text, colors, and icons, providing a visually engaging representation of complex ideas.
How to use the tree diagram template in Miro
Central node: Start by adding your main idea or concept to the central node.
Branch out: Extend your tree by adding branches and sub-branches to represent hierarchical relationships.
Customization: Personalize each node with text, colors, and icons to enhance visual clarity.
Automated features: Easily expand your diagram with a single click, using automated features for seamless tree growth.
Contextual artifacts: Enhance your tree diagram by adding relevant artifacts to the Miro board, providing additional context and information.
Why should you use a tree diagram template?
Visual clarity: Simplify complex ideas by visually organizing information hierarchically.
Streamlined decision-making: Enable decision-making processes by providing a clear overview of relationships and dependencies.
Effective communication: Enhance communication by presenting information in a visually engaging and easily digestible format.
Flexible adaptability: Adapt your tree diagram to evolving ideas, ensuring your visual representation stays relevant and up-to-date.
Collaborative work: Foster collaboration among team members by using a shared visual space to brainstorm and organize thoughts.
Explore Miro's automated tree diagram maker and start creating your tree diagram now.
Can I add more branches to my tree diagram after creating it?
Absolutely! With the tree diagram template in Miro, you can easily add branches and sub-branches as your ideas evolve. Just click and expand as needed.
Can I change the colors of individual nodes for emphasis?
Yes, customization is a key feature. You can personalize each node with different colors, helping to emphasize specific elements and enhance visual hierarchy.
Is the tree diagram template suitable for collaborative work?
The template is designed for collaboration, allowing team members to contribute, edit, and build upon the tree diagram in real-time.
Can I export my tree diagram for use in presentations or documents?
Yes, Miro provides export options, allowing you to save your tree diagram as an image or PDF for seamless integration into presentations or documents.
Get started with this template right now.
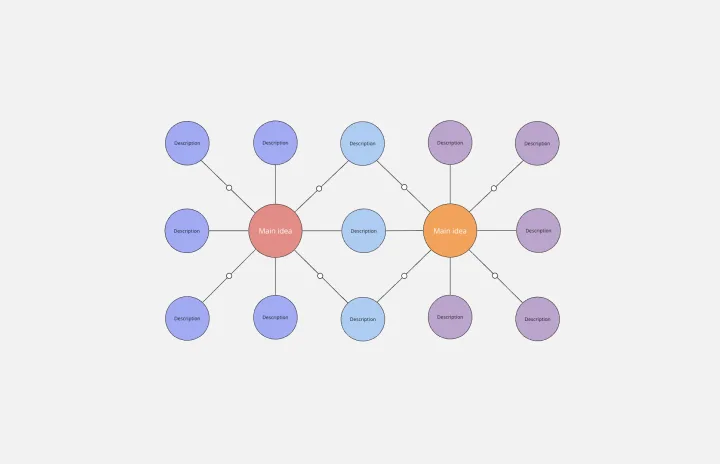
Double Bubble Map Template
Works best for:
Diagramming, Mapping, Brainstorming
Double Bubble Map Template serves as a powerful tool to facilitate teamwork and streamline idea exploration. This adaptable template empowers teams to brainstorm, analyze, and compare concepts with ease, making it an invaluable asset for enhancing creativity and fostering clarity among team members.
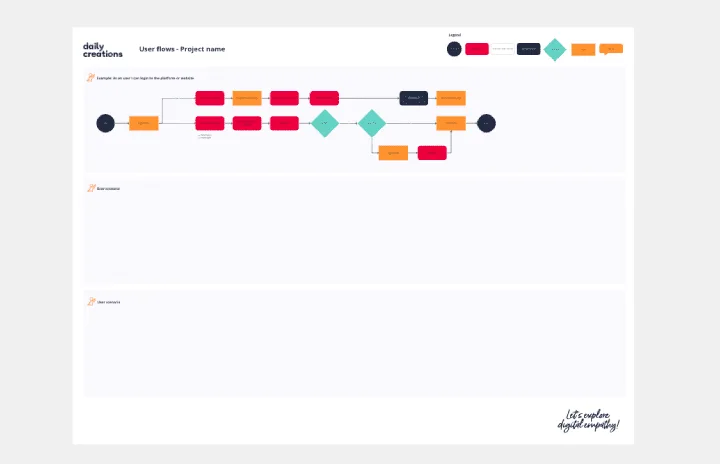
User Flows
The User Flows template offers a visual tool for mapping out the sequence of steps that users take to accomplish a specific task or achieve a goal within a digital product or service. It provides elements for documenting user interactions, screens, and decision points along the user journey. This template enables UX designers and product teams to understand user behaviors, identify pain points, and optimize the user experience effectively. By promoting user-centric design and empathy, the User Flows template empowers teams to create intuitive and engaging digital experiences that meet user needs and drive satisfaction.

Onion Diagram Template
Works best for:
Diagramming, Mapping and Diagramming
The Onion Diagram Template is a distinct tool designed to visually represent layers of a specific concept, system, or process, akin to the layers of an onion. Each concentric layer of the diagram provides insights into a different aspect or phase of the topic at hand, moving from the core foundational element outwards to more peripheral components. One of the prime benefits of this template is its ability to offer hierarchical clarity. Users can immediately discern the importance, sequence, or interrelation of different elements within a system, facilitating enhanced comprehension and efficient decision-making.
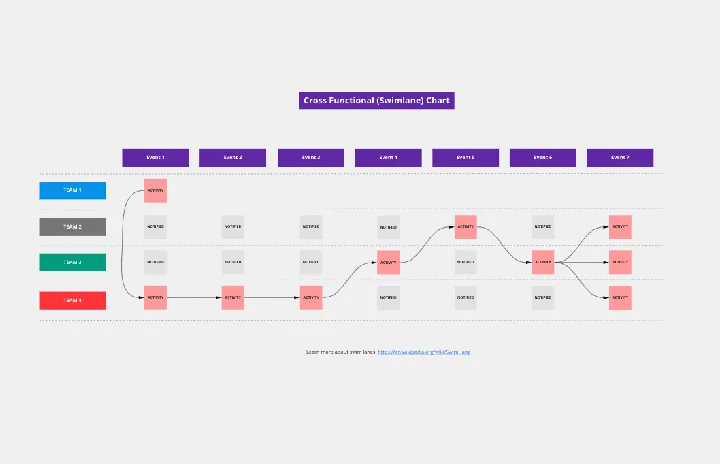
Cross Functional (Swimlane) Chart
Works best for:
Flowcharts, Mapping, Diagrams
The Cross Functional (Swimlane) Chart template offers a visual tool for mapping out processes or workflows with multiple stakeholders or functional areas. It provides swimlanes for organizing tasks and responsibilities by department or role. This template enables teams to visualize process flows, identify handoffs, and improve coordination and collaboration across functions. By promoting transparency and accountability, the Cross Functional (Swimlane) Chart empowers organizations to streamline workflows and drive cross-functional alignment effectively.
CI/CD Pipeline Diagram Template
Works best for:
Diagramming, Development
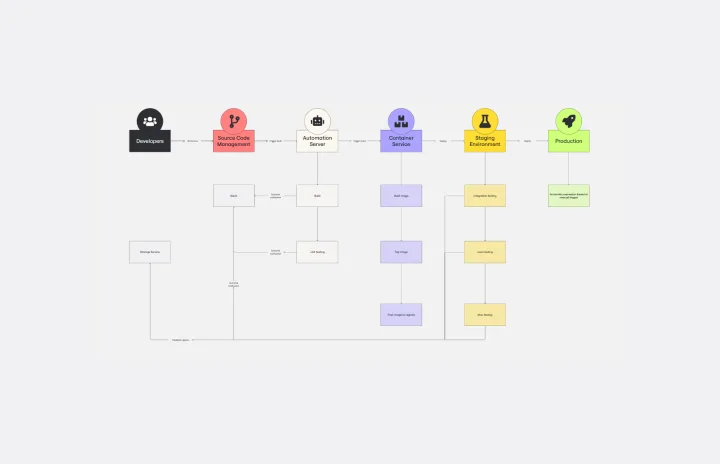
The CI/CD template is a well-designed roadmap for software deployment that enables a smooth and automated flow from development to production. This strategic layout includes critical elements such as source code management, automation servers, container orchestration, staging environments, and the final deployment to production. One of the key benefits of using such a template is that it builds a robust deployment pipeline, which significantly reduces manual intervention and human error. By visualizing each step and integrating automation throughout, teams can achieve faster deployment cycles, ensuring that new features, updates, and fixes are delivered to users promptly and reliably. This enhanced pace does not compromise quality, as the template inherently supports continuous testing and quality assurance, ensuring that each update is quick but also secure and stable before it is delivered to the end user.
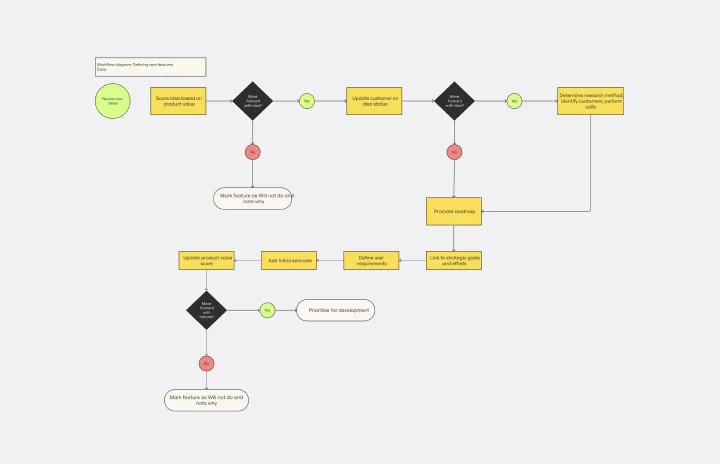
Workflow Diagram Template
Works best for:
Diagramming, Mapping, Process mapping
The Workflow Diagram Template maps out and represents processes or systems using standardized symbols and shapes. By delineating the various steps or stages in a process, it ensures that tasks flow seamlessly from initiation to completion. One of the standout benefits of using this template is its clarity. By translating processes into a visual format, all participants can gain a comprehensive understanding at a glance, eliminating confusion and ensuring everyone is on the same page. This clarity not only promotes efficient task execution but also fosters collaboration among team members.