Cause and Effect Diagram Template
Quickly analyze relationships and identify the root causes within a system with the cause and effect diagram template.
Trusted by 65M+ users and leading companies


About the Cause and Effect Diagram Template
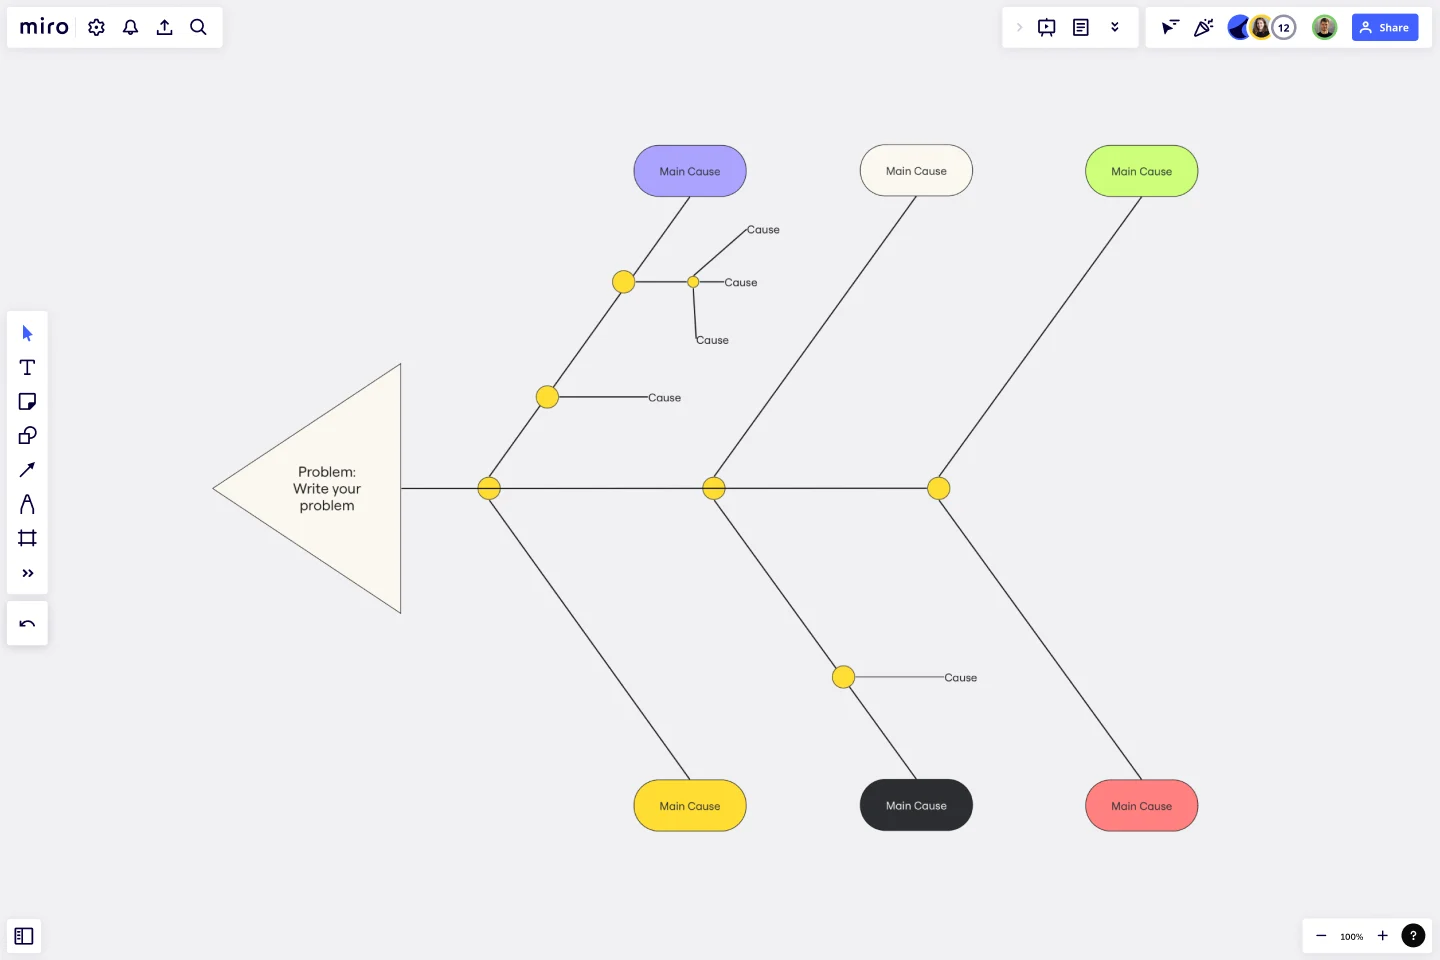
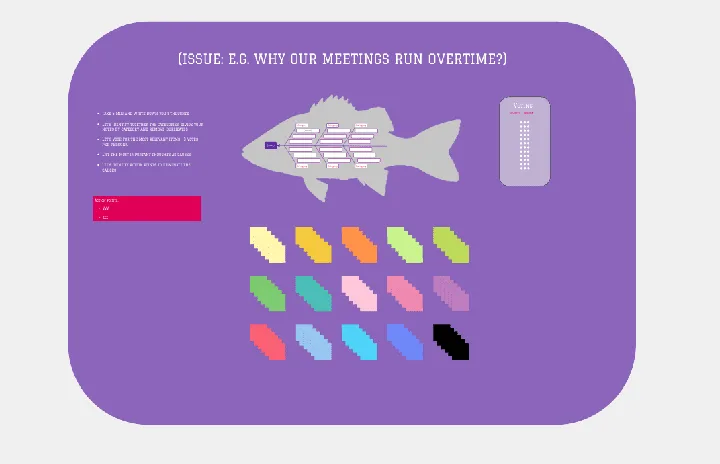
The cause-and-effect diagram template is an effective tool for analyzing complex relationships and identifying the root causes within a system. This template is a more straightforward version of the Fishbone or Ishikawa diagram. It is used to visually represent the cause-and-effect relationships in a structured manner. Whether you are solving problems, improving a process, or troubleshooting, this template provides a systematic approach to identifying and understanding the factors influencing a specific issue.
Understanding the cause and effect diagram template
The cause and effect diagram template categorizes potential causes into branches. Here is how the template is built:
Problem statement: Clearly defines the identified issue as the central focal point for exploring potential causes.
Categories of causes: Organizes potential causes into branches, offering a systematic and categorized approach to analysis.
Main bones: Represents primary categories of causes as main branches extending from the spine of the fishbone diagram.
Sub-branches: Break down each main branch into sub-branches, thoroughly exploring potential causes.
Analysis section: Dedicates space for in-depth analysis, enabling teams to fully explore each cause's impact on the identified problem.
How to use the cause and effect diagram template
Edit with precision: You can customize the template easily by using drag-and-drop functionality. This will help you address your specific problem and its potential causes.
Collaborative analysis: You can engage in real-time collaboration with your team members directly on the Miro board. This will foster collective analysis and brainstorming sessions.
Root cause identification: You can use the template to systematically identify root causes. This will help you gain a thorough understanding of the problem and enable you to solve it effectively.
Why should you use a cause-and-effect diagram template?
Structured problem analysis: Organize and analyze potential causes systematically, providing a structured framework for identifying the root cause of a problem.
Team collaboration: Facilitate collaborative problem-solving sessions, ensuring diverse perspectives contribute to a comprehensive analysis.
Visual clarity: Enhance understanding through visual representation, facilitating comprehension of complex cause-and-effect relationships.
Strategic decision-making: Equip teams with insights to make informed and strategic decisions based on a thorough understanding of the problem's causes.
Process improvement: Drive continuous improvement by systematically addressing root causes enhancing efficiency and effectiveness within processes.
Is there a recommended order for exploring the causes in the template?
While there is no strict order, initiating analysis with main branches and progressively exploring sub-branches for a thorough and structured examination is often beneficial.
Can I export or share the Cause and Effect Diagram created in Miro with stakeholders outside the platform?
Miro offers export and sharing features, allowing users to share the diagram with stakeholders outside the platform for review and collaboration.
Get started with this template right now.
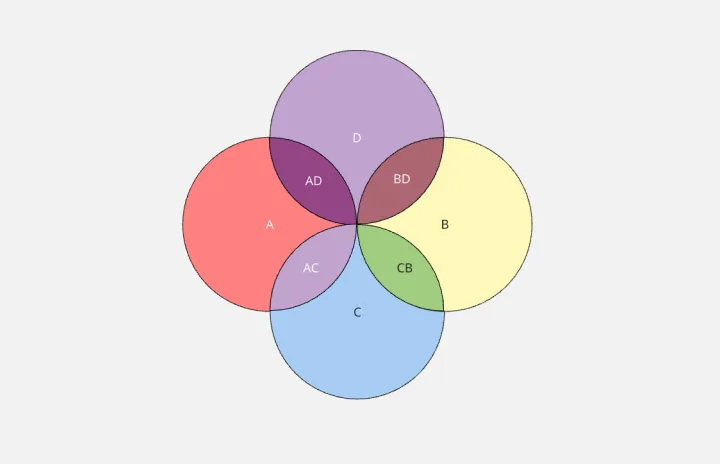
4-Circle Venn Diagram Template
Works best for:
Diagramming, Mapping, Brainstorming
The 4-Circle Venn Diagram Template has an easy, interactive, and dynamic way to visualize complex relationships between data sets. Empower your team's collaboration and communication with this powerful tool.
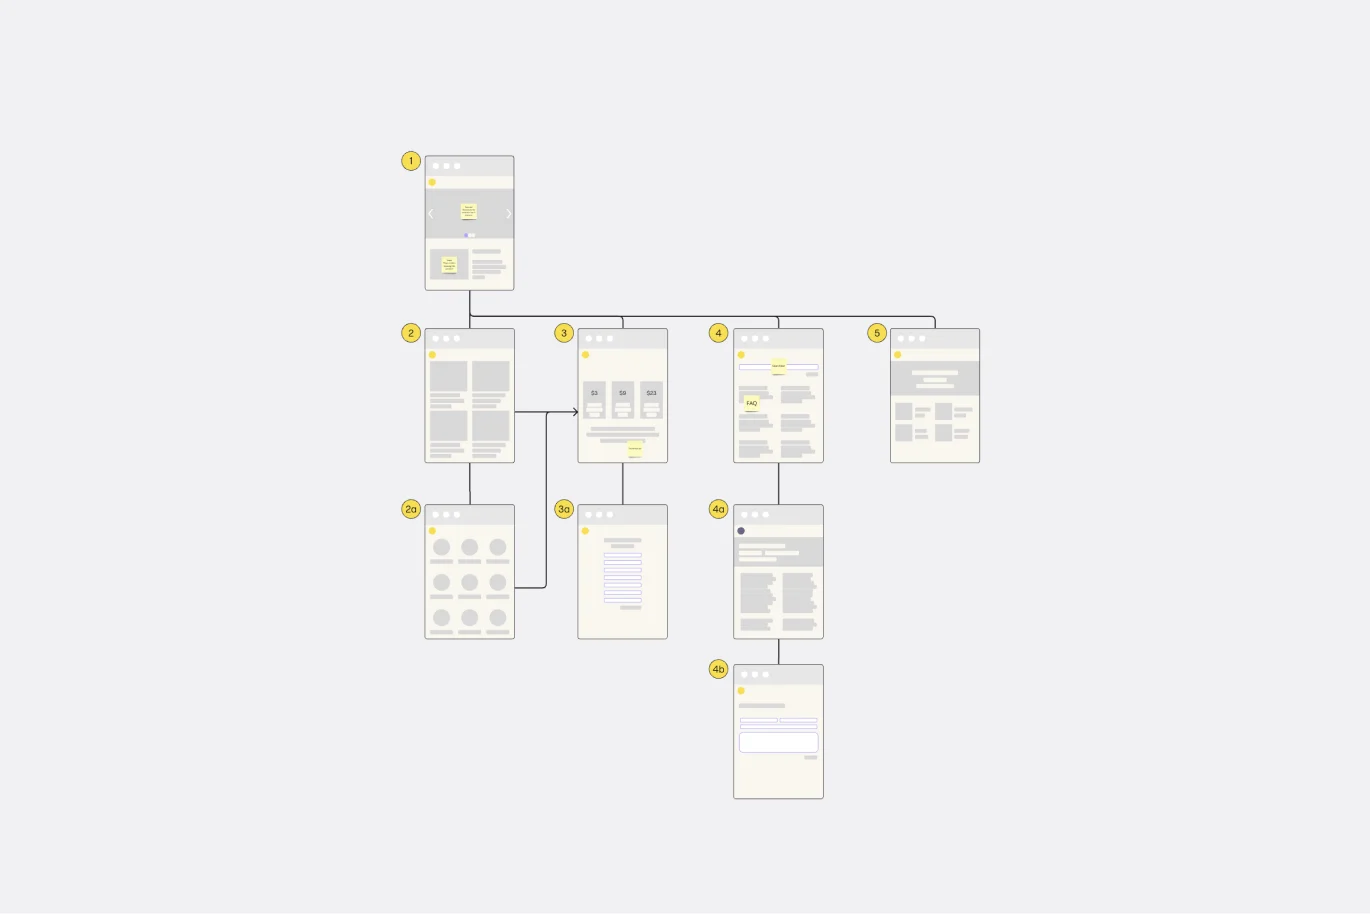
Website Flowchart Template
Works best for:
Flowcharts, Mapping, User Experience
A website flowchart, also known as a sitemap, maps out the structure and complexity of any current or future website. The flowchart can also help your team identify knowledge gaps for future content. When you’re building a website, you want to ensure that each piece of content gives users accurate research results based on keywords associated with your web content. Product, UX, and content teams can use flowcharts or sitemaps to understand everything contained in a website, and plan to add or restructure content to improve a website’s user experience.
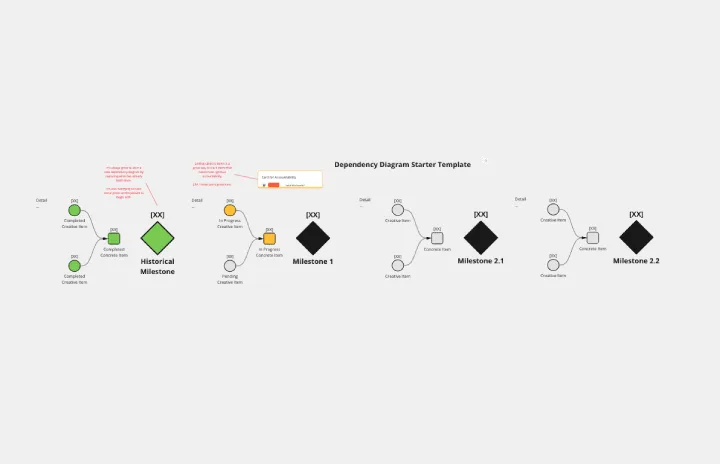
Dependency Diagrams Educational Board
Works best for:
Diagramming
The Dependency Diagrams Educational Board template provides a visual tool for teaching and learning about dependency relationships between components in systems. It offers a structured framework for illustrating dependencies, connections, and interactions within a system or process. This template enables educators to explain complex concepts effectively and engage learners in interactive activities. By promoting visual learning and understanding of dependencies, Dependency Diagrams empower students to grasp fundamental principles of systems thinking and analysis.
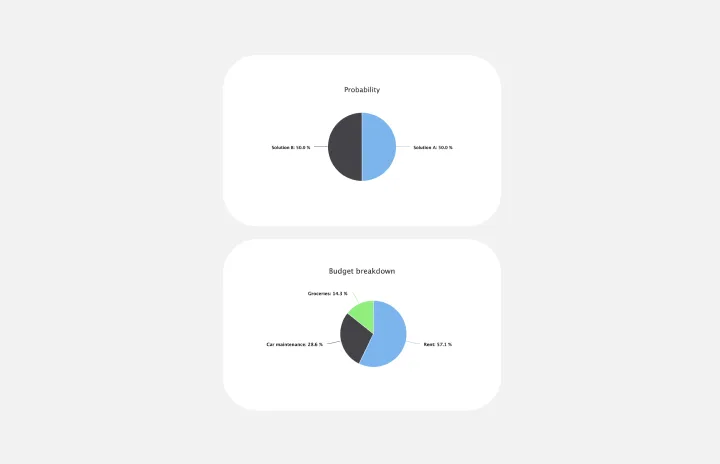
Pie Chart Template
Works best for:
Education, Operations
Pie charts are an excellent way to present relationships between datasets graphically, where you can quickly compare information and see contrast right away. Professionals from many fields use pie charts to support their presentations and enrich their storytelling as it’s one of the most commonly used data charts.
Fishbone Diagram by Hanna Havulinna
Works best for:
Diagramming
The Fishbone Diagram template, also known as the Ishikawa or Cause-and-Effect diagram, offers a visual tool for identifying and analyzing root causes of problems or issues. It provides a structured framework for categorizing potential causes into major categories such as people, process, environment, and equipment. This template enables teams to conduct root cause analysis systematically, facilitating problem-solving and decision-making. By promoting a structured approach to problem analysis, the Fishbone Diagram empowers teams to address issues effectively and implement corrective actions efficiently.

UML State Machine Diagram Template
Works best for:
Software Development, Mapping, Diagrams
Visualize the workflow of a process and how objects perform actions based on different stimuli. State machine diagrams are valuable for understanding how an object responds to events at the different stages of its life cycle. They are also helpful for visualizing event sequences in a system.