ICS Org Chart Template
Use the ICS Org Chart Template to map the Incident Command System's hierarchy visually. Navigate roles and responsibilities with ease.
Trusted by 65M+ users and leading companies


About the ICS Org Chart Template
In today's work environment, having tools that provide flexibility and clarity is crucial, particularly when it comes to coordinating teams and ensuring seamless communication. The ICS Org Chart Template is an excellent solution in this regard. ICS, which stands for Incident Command System, is a standardized all-hazard incident management concept used in the United States. It is a complex system that demands careful organization and structure.
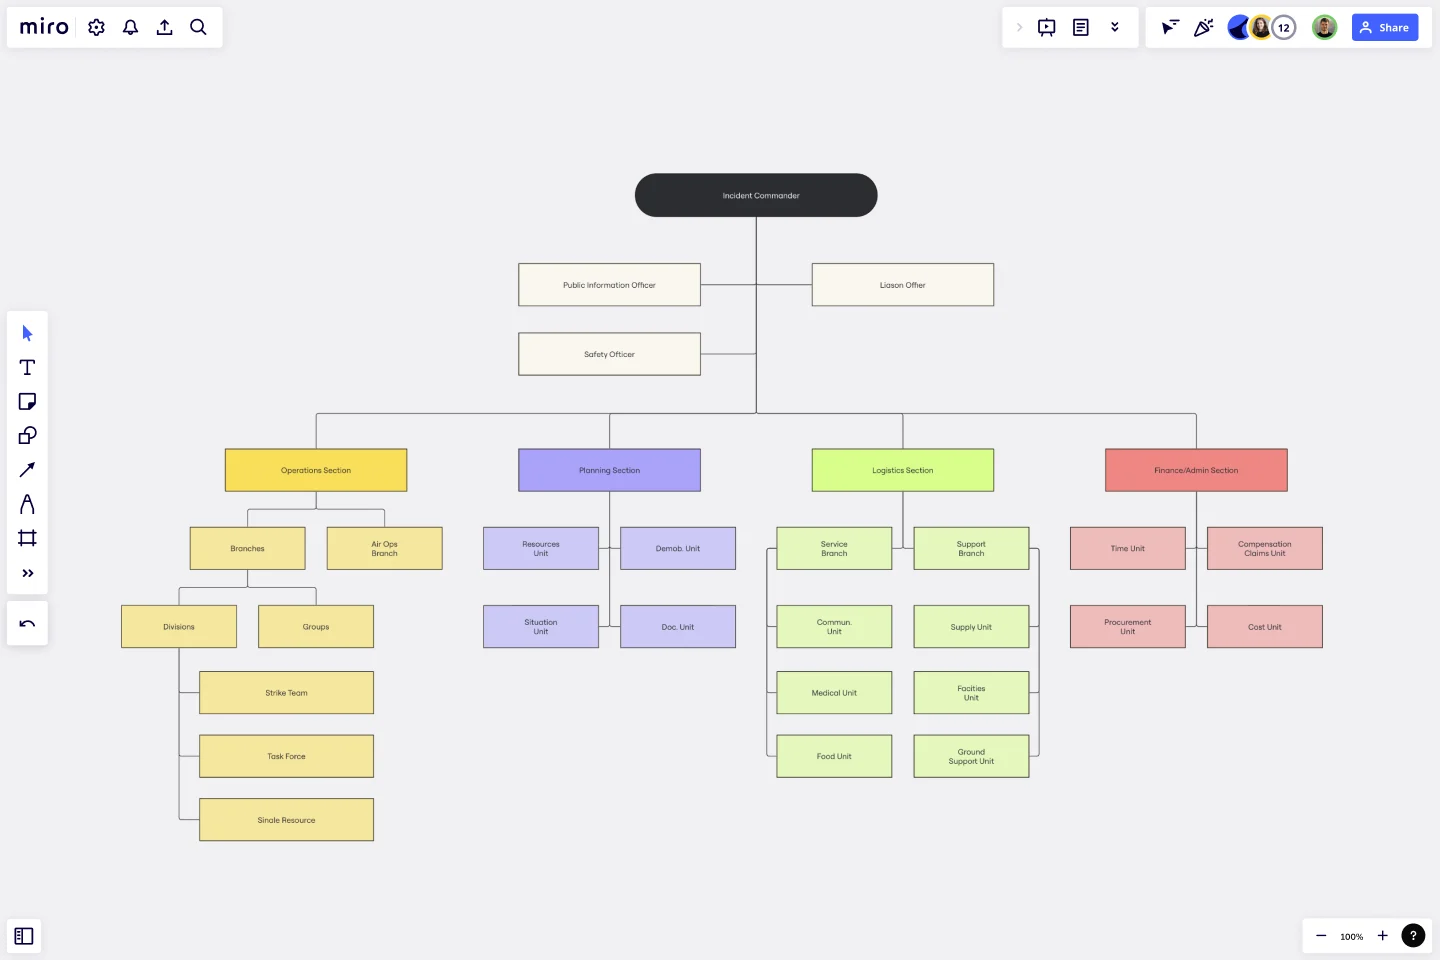
The ICS Org Chart Template is specifically designed to help teams understand the structure of this system. It provides a clear and visual representation of roles, responsibilities, and chains of command, making it an invaluable tool for any organization.
This template offers a structured blueprint of the ICS hierarchy, which can be easily customized per the user's requirements. Each section of the template represents a specific area of responsibility within the ICS, and the sections are connected via connector lines to show the flow of command and reporting lines. With clearly defined roles for each position, from the Incident Commander to the various branches and units, users can navigate the complex ICS web with ease and make necessary modifications according to their specific needs.
How to use the ICS Org Chart Template
Customize the template: Click on any shape or connector line. You'll notice that editing them is straightforward—resize, relabel, or reposition as needed.
Expand: If your organizational structure requires more layers or units, add more shapes and connect them using the automated diagramming features. This ensures consistency in design and flow.
Add context: To provide more detailed information, you can effortlessly drag and drop any artifact onto the board. Whether it's a document, image, or link, it integrates seamlessly, enriching the context.
Why should you use an ICS Org Chart Template?
Clarity and visualization: It provides a clear and visual representation of roles and reporting lines, ensuring that everyone understands their responsibilities and who they should report to.
Standardization: It maintains consistency in the representation of the ICS structure, which is essential for effective communication.
Flexibility: Although it offers a standardized view, the template is highly customizable to cater to various organizational needs.
Efficiency: It reduces the time spent on creating an organizational chart from scratch and ensures rapid onboarding of team members for efficient task execution.
Integration: It allows easy addition of external resources, ensuring a comprehensive view of processes and responsibilities.
Miro is the perfect organizational chart builder to help visualize and understand your organization's hierarchical structure and reporting lines between roles. If you're interested in learning more about organizational charts you can read our in-depth guide.
Can I integrate external links and resources into the chart?
The template allows seamless integration of external artifacts, providing a richer context.
How many levels can I add to the chart?
The template is flexible, allowing you to add as many levels as required by your organizational structure.
Is the template suitable for organizations outside the U.S.?
While the ICS system originates from the U.S., the principles of organization and structure are universal. The template can be adapted and used by organizations globally.
Do I need prior knowledge of ICS to use this template?
While prior knowledge is helpful, the template is intuitive enough for those unfamiliar with ICS, serving as both a learning tool and an organizational asset.
Get started with this template right now.
Genogram Template
Works best for:
Diagramming
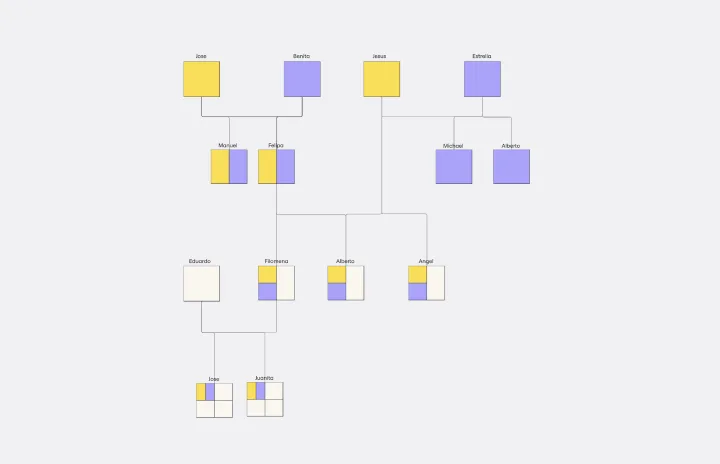
The Genogram Template maps out family structures and relationships with exceptional depth and detail. Unlike traditional family trees, this template provides a comprehensive perspective by encapsulating familial connections, emotional ties, and significant life events. Create a genogram to unearth patterns and trends within a family, whether hereditary or environmental. Professionals across different domains can gain a holistic understanding of familial dynamics by showing deep insights into the nuances of relationships, facilitating better communication and problem-solving.
User Flow Example
Works best for:
Flowcharts, Mapping, Diagrams
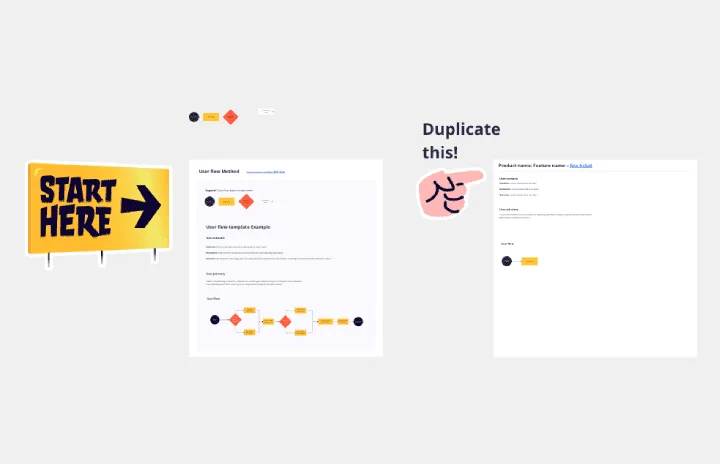
The User Flow Example template offers a visual representation of a typical user flow within a digital product or service. It provides elements for documenting user interactions, navigation paths, and decision points along the user journey. This template enables UX designers and product teams to understand user behavior, identify pain points, and optimize the user experience. By providing a concrete example of user flow, the User Flow Example template serves as a valuable reference for designing intuitive and engaging digital experiences that meet user needs effectively.
Double Bubble Map Template
Works best for:
Diagramming, Mapping, Brainstorming
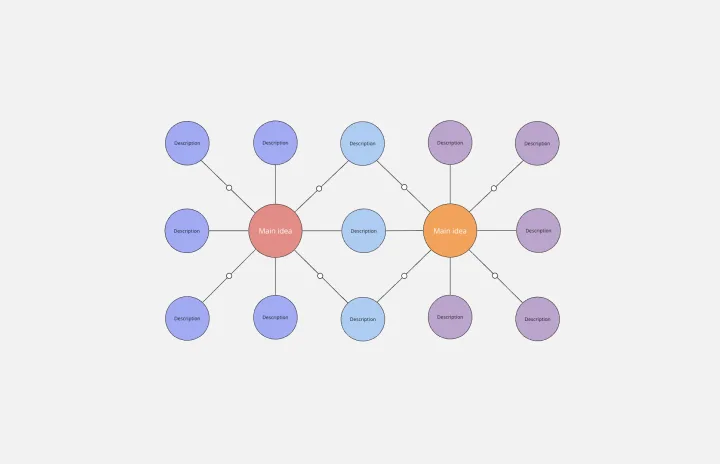
Double Bubble Map Template serves as a powerful tool to facilitate teamwork and streamline idea exploration. This adaptable template empowers teams to brainstorm, analyze, and compare concepts with ease, making it an invaluable asset for enhancing creativity and fostering clarity among team members.
Turtle Diagram Template
Works best for:
Diagramming
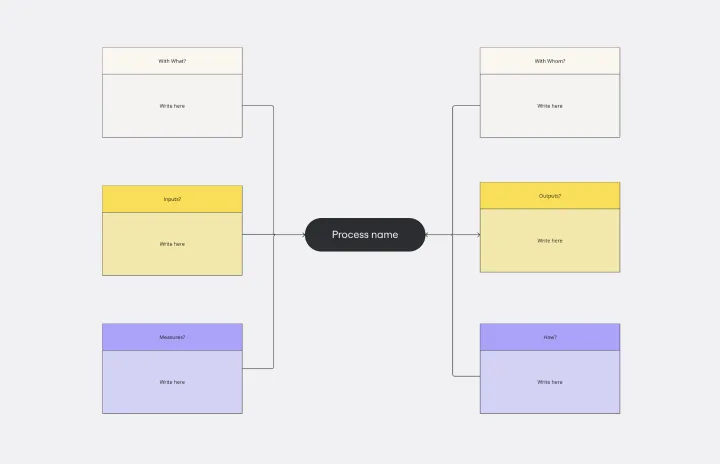
The Turtle Diagram Template is an essential tool for capturing the essence of a process. It offers many benefits, but one stands out: it fosters clear and comprehensive communication within teams. By breaking down processes into digestible components, the template creates a common ground for discussion. It helps team members unfamiliar with certain processes or from different departments collaborate effectively by ensuring everyone's on the same page about the inputs, outputs, roles, resources, and procedures. This is crucial for organizations that aim to maintain coherence in quality management practices and drive collective efforts toward operational excellence.
Cross Functional (Swimlane) Chart
Works best for:
Flowcharts, Mapping, Diagrams
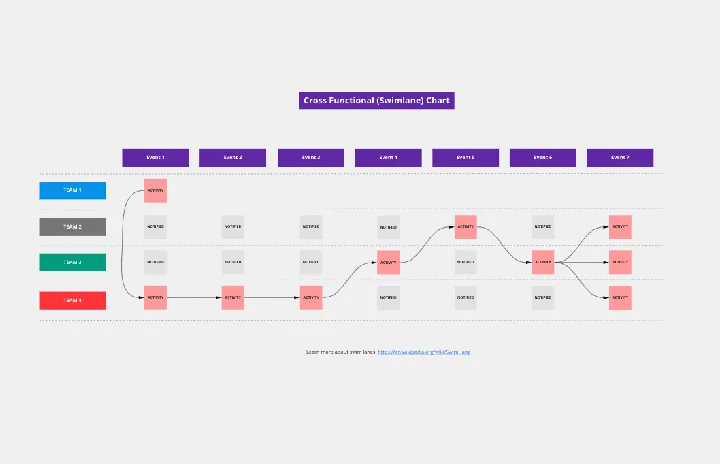
The Cross Functional (Swimlane) Chart template offers a visual tool for mapping out processes or workflows with multiple stakeholders or functional areas. It provides swimlanes for organizing tasks and responsibilities by department or role. This template enables teams to visualize process flows, identify handoffs, and improve coordination and collaboration across functions. By promoting transparency and accountability, the Cross Functional (Swimlane) Chart empowers organizations to streamline workflows and drive cross-functional alignment effectively.
ICOR® Workflows
Works best for:
Flowcharts, Diagrams, Mapping
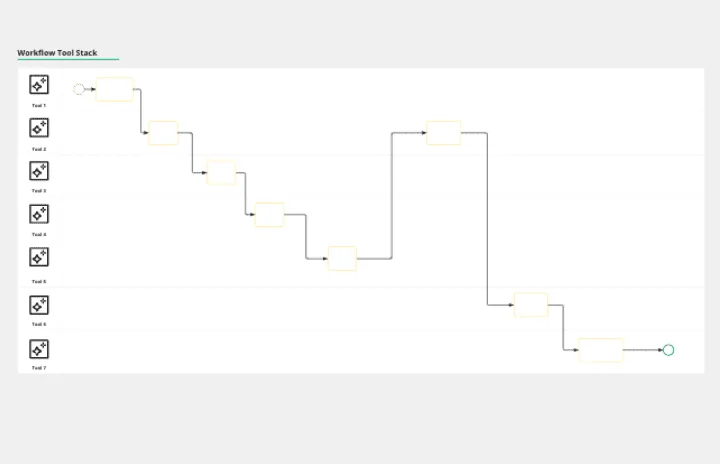
The ICOR® Workflows template offers a visual framework for documenting and optimizing business processes according to the ICOR® (Input, Control, Output, Resources) methodology. It provides elements for defining process inputs, controls, outputs, and resource requirements. This template enables organizations to streamline operations, enhance quality management, and achieve process excellence. By promoting systematic process documentation and analysis, the ICOR® Workflows template empowers organizations to optimize efficiency, minimize risks, and deliver value to stakeholders effectively.