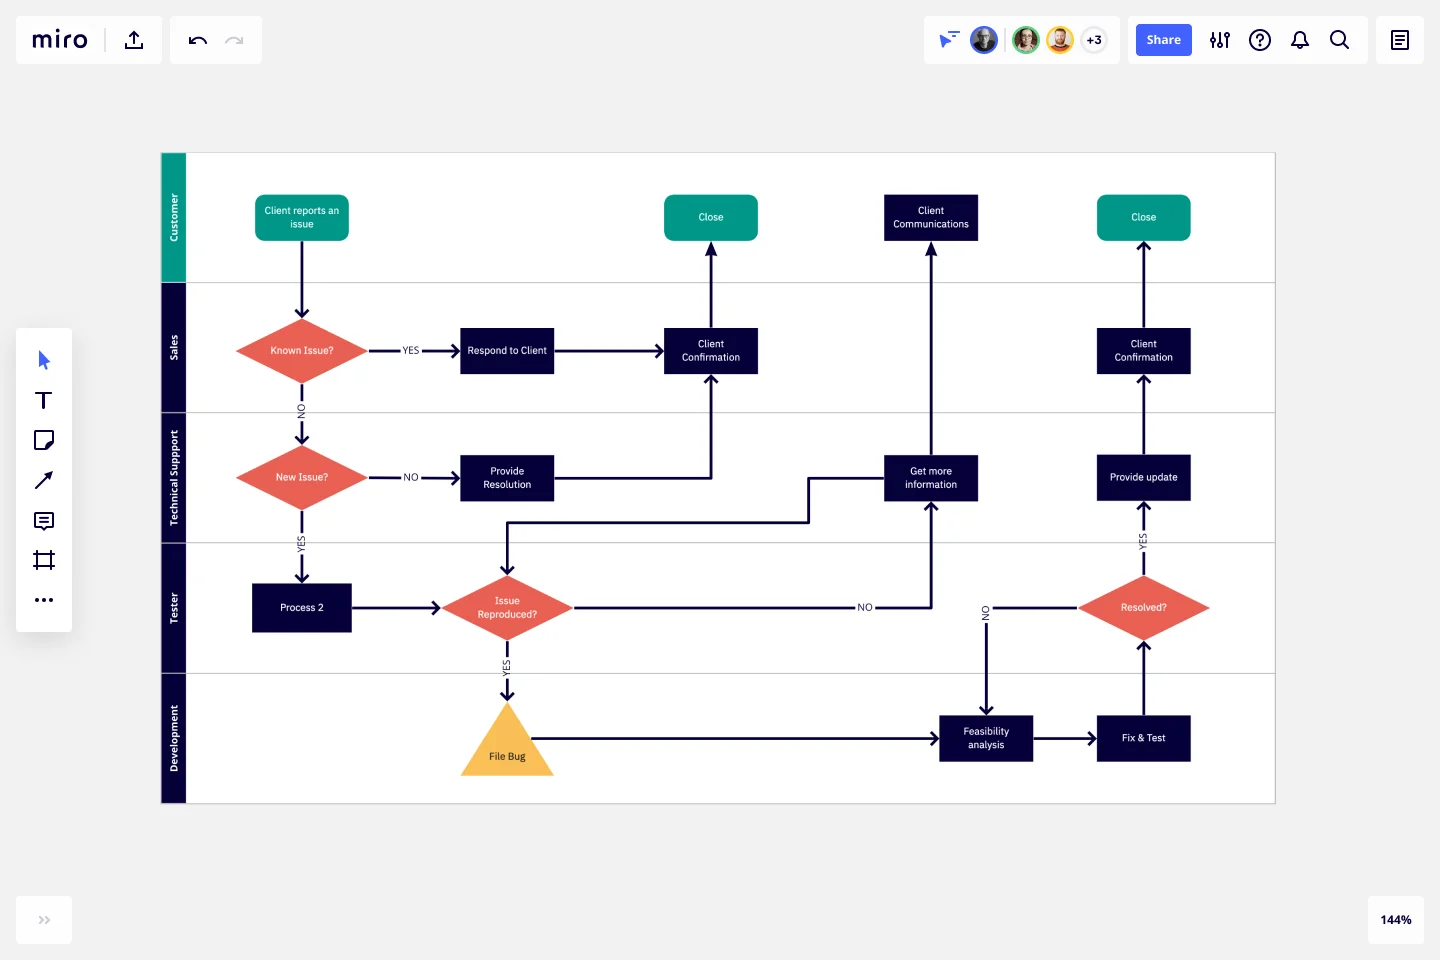
Cross Functional Flowchart
Plan for any undesirable actions, outcomes, or behaviors that occur in the workplace. Clarify different team responsibilities and identify bottlenecks using a Cross-Functional flowchart.
Trusted by 65M+ users and leading companies


About the Cross-Functional Flowchart
Cross-functional flowcharts (also known as a “swim lane diagram” or “cross-functional process map” ) can help you visualize business relationships and end-to-end project contributions. These elements that depend on each other can include the relationship between functions and stakeholders (such as departments and clients) or project phases and milestones.
The map format allows you to make your business processes or project phases more transparent with added layers of detail and structure.
Keep reading to learn more about cross-functional flowcharts.
What is a Cross-Functional flowchart?
A cross-functional flowchart shows how people from different teams contribute to, and complete, a business process or project.
The lanes in the chart can help separate and clarify which department, employee, or person outside of the business contributes to a business or project.
Each person (such as a customer, client, or representative from a specific function) who contributes to the big-picture process is assigned a lane. That assigned area outlines all the activities they are responsible for moving forward to the finish line.
When to use a Cross-Functional flowchart
Cross-functional flowcharts can be used to improve your team and organizational processes. These changes can include the need to work out what factors create inefficiencies and address delays that impact both internal and external stakeholders.
A cross-functional flowchart can also help different teams or departments better understand each other’s responsibilities and capabilities. These details are especially useful when people haven’t worked together before or struggle to understand what different teams do on a day-to-day basis. Consistently collaborating with an online flowchart creates greater transparency and alignment.
Create your own Cross-Functional flowchart
Making your own cross-functional flowchart is easy. Miro’s virtual collaboration platform is the perfect flowchart maker and canvas for sharing them. Get started by selecting the Cross-Functional Flowchart Template, then take the following steps to make one of your own.
1. Decide what your lanes are.
Decide what divisions (functions) or identities (internal or external stakeholders) need representation on the flow chart.
2. Define what the start of your process is.
What’s the first action that triggers a series of tasks or interactions? Maybe it’s a client confirmation or a customer request. Each division will have a different starting point, but you’ll see that there may be points in the journey or interaction where functions or individuals coincidentally meet (or need to coordinate and communicate, for a smoother process to roll out).
3. Keep adding steps to your process until you get to the last step or endpoint.
What does the flow of information look like from start to finish? What decisions need to be made? Ask yourself and your team these questions as you map out each situation. Try to convert your quick sketches to sticky notes, shapes, and connecting lines that work together to create a logical flow chart.
4. Update your flow chart as needed—and use it alongside other process-based templates.
Cross-functional process maps were designed to work alongside – or be connected to – other templates, such as a product roadmap or stakeholder mapping tool. Rally your teammates, stakeholders, and leadership team around a people-first vision by helping them see the bigger picture alongside the all-important details.
Get started with this template right now.
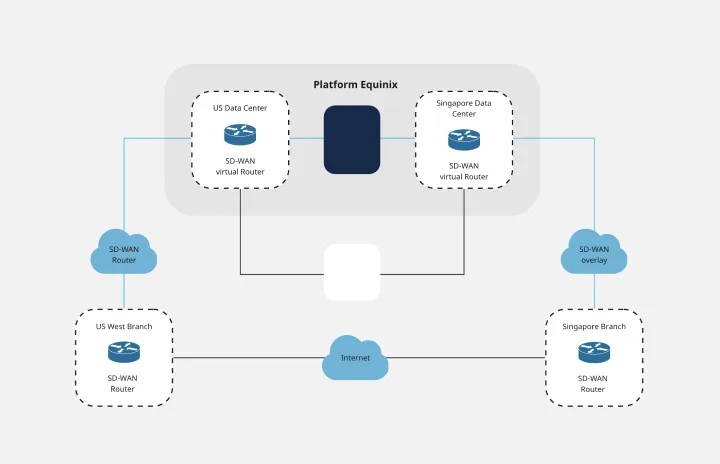
Cisco Data Network Diagram Template
Works best for:
Software Development, Diagrams
Cisco offers data center and access networking solutions built for scale with industry-leading automation, programmability, and real-time visibility. The Cisco Data Network Diagram uses Cisco elements to show the network design of Cisco Data Networks visually.
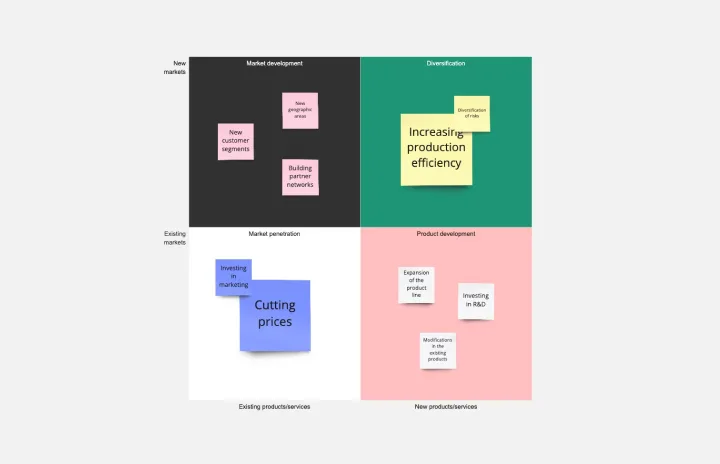
Ansoff Matrix Template
Works best for:
Leadership, Operations, Strategic Planning
Keep growing. Keep scaling. Keep finding those new opportunities in new markets—and creative new ways to reach customers there. Sound like your approach? Then this template might be a great fit. An Ansoff Matrix (aka, a product or market expansion grid) is broken into four potential growth strategies: Market Penetration, Market Development, Product Development, and Diversification. When you go through each section with your team, you’ll get a clear view of your options going forward and the potential risks and rewards of each.
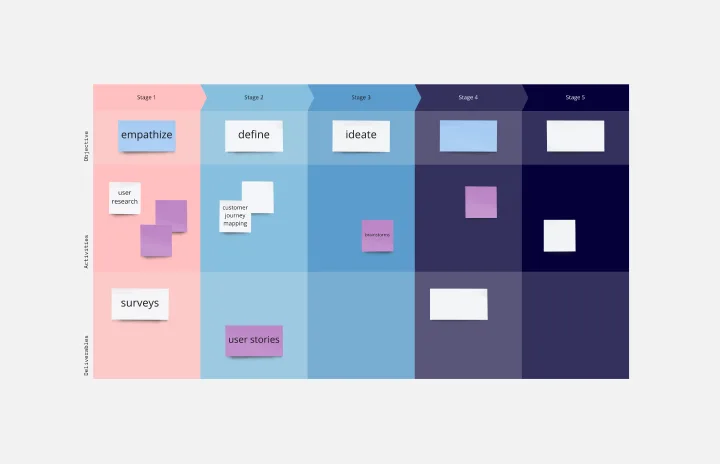
Process Map Template
Works best for:
Agile Methodology, Product Management, Mapping
Process mapping allows you to assess, document, and strategize around any plan or approach your team has put in place. It’s a useful tool for eliminating or preventing blockers. Organized by stages, a process map enables your team to divide up a process or system and record deliverables and action items at each stage of the process. By breaking down the objectives, activities and deliverables at any stage of a project, you can gain insight into whether you are on track or effectively working through a problem.
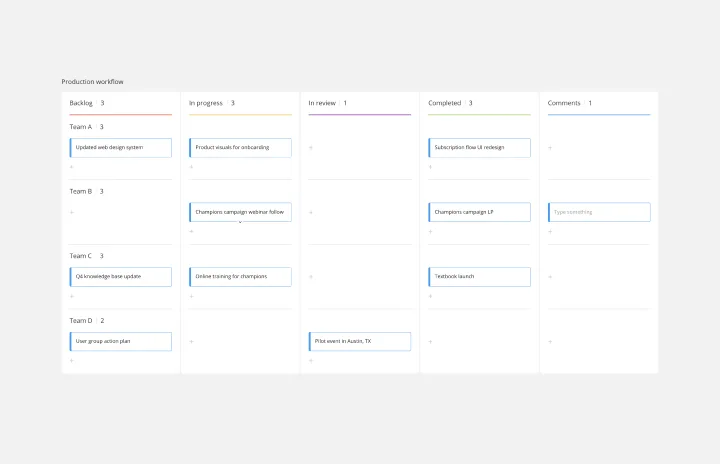
Production Workflow Template
Works best for:
Agile Workflows, Agile Methodology, Project Management
Whether you’re producing a podcast, a marketing campaign, a TV show, or a piece of content, establishing a production workflow is crucial. A production workflow creates a visual guide to the different steps in a process. It can be used to train new team members or give a high-level overview to stakeholders. Although production workflows vary by team and business, they generally contain information about who the stakeholders are, how you brainstorm ideas, what your timeline looks like, and what resources you need to succeed.
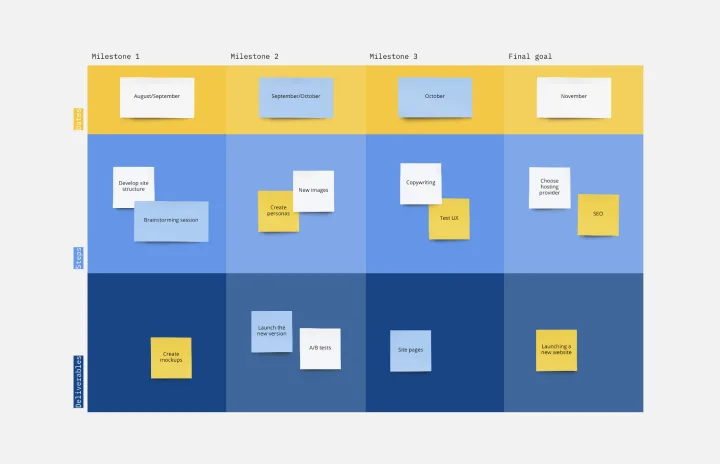
Milestone Chart Template
Works best for:
Project Management, Strategic Planning, Project Planning
When your team is collaborating on a large project, keeping track of the many tasks and multiple timelines can be a challenge. That’s why you need a milestone chart. These visual representations of important project events will make it simple for your team to stay on schedule and reach goals on time. And it’s so easy to get started — just determine the major milestones, use our template to create a milestone chart, and define the key dates and deliverables each milestone will require.

Azure Architecture Diagram Template
Works best for:
Software Development, Diagrams
The Azure Architecture Diagram Template is a diagram that will help you visualize the combination of any data and build and deploy custom machine learning models at scale. Azure is Microsoft’s cloud computing platform, designed to provide cloud-based services such as remote storage, database hosting, and centralized account management. Use Azure Architecture Diagram template to build sophisticated, transformational apps.