Ansoff Matrix Template
Explore opportunities for growing your business with the Ansoff Matrix Template.
Trusted by 65M+ users and leading companies


About the Ansoff Matrix template
When your business is doing well, it can be easy to slip into complacency. But if your organization is to keep growing and scaling, you’ll have to look for new ways to boost your bottom line and reach new customers. The Ansoff Matrix, also known as the product or market expansion grid, can help you do just that.
An Ansoff Matrix is a strategic tool that allows you to evaluate numerous options for growing your business. It helps you evaluate the potential risks of each option and to devise a plan that fits your specific organization. Igor Ansoff developed the matrix in 1957, and since then, numerous business leaders have used it to jumpstart their business’s growth.
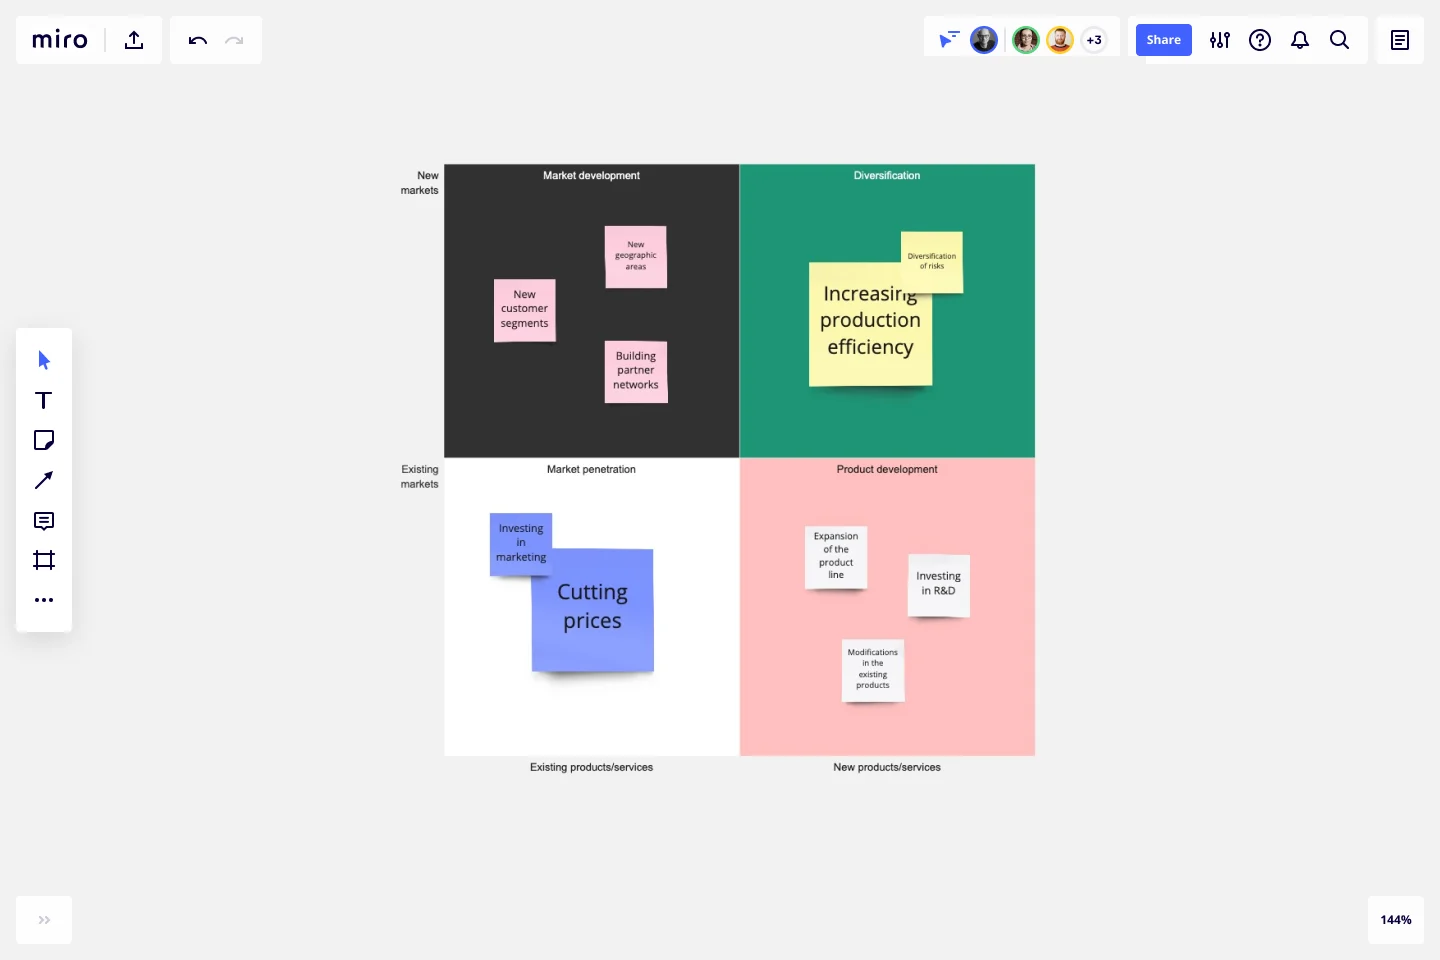
While there are some variations, the typical Ansoff Grid contains four quadrants. Each quadrant contains a potential growth strategy. Whenever you move into a new quadrant, either horizontally or vertically, your risk increases.
How do you use the Ansoff Matrix?
The Ansoff Matrix is divided into four sections that place markets and products/services depending on whether they already exist or represent a future opportunity. The four sections are market penetration, market development, product development, and diversification. Market penetration refers to selling more of your products and services to existing customers, market development refers to entering new markets, product development refers to developing your existing products or services, and diversification refers to moving into new markets with new products and services, increasing sales with your existing customer base, and acquisition. Go through each section with your team and determine where there are areas for making changes or improvements.
When should you use the Ansoff Matrix?
You should use the Ansoff Matrix whenever you do strategic planning for your marketing organization. You may find it beneficial to fill out the matrix at least once a year, though potentially more frequently if conditions are changing rapidly in your industry.
What factors go into an Ansoff Matrix?
Factor 1 - Market penetration. The lower left quadrant contains the safest of the four options. Market penetration focuses on boosting sales of your product in your existing market. This is a low-risk option because you already know the market and you’re aware of your product’s strengths and weaknesses relative to your competitors.
Factor 2 - Product development. The lower right quadrant is slightly more risky. In this approach, you’re introducing a new product into your existing market.
Factor 3 - Market development. The upper left quadrant is even riskier. In this case, you’re launching an existing product in a new market. This strategy involves either finding a new use case for your product or adding features so that it meets a different customer need.
Factor 4 - Diversification. The upper right quadrant contains the riskiest option. You’re introducing a new product into a new market.
Get started with this template right now.

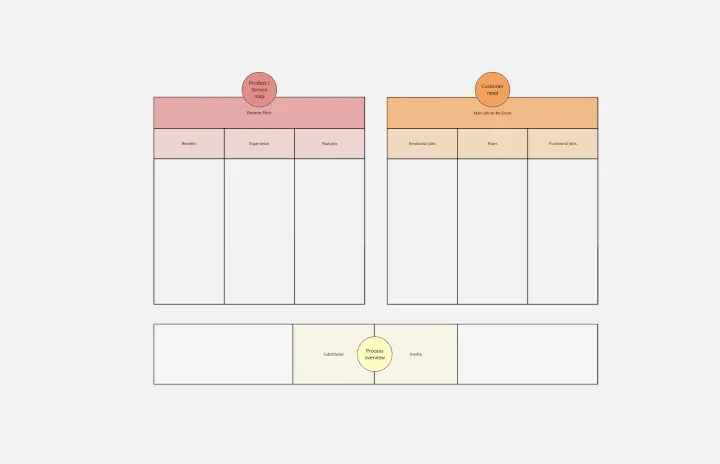
Competitive Analysis Template
Works best for:
Marketing, Decision Making
Developing a great product starts with knowing the lay of the land (meaning who you’re up against) and answering a few questions: Who are your competitors? How does your product or service compare? What makes you stand out? A competitive analysis will help find the answers, which can ultimately shape your product, value prop, marketing, and sales strategies. It’s a great exercise when a big business event is about to occur — like a new product release or strategic planning session.
Value Proposition Template
Works best for:
Strategy & Planning, Product Strategy
The Value Proposition Template is a framework that empowers businesses to articulate their offerings' core advantages. By breaking down an offering into its essential elements, this template ensures that stakeholders grasp the unique value a product or service brings to the market.
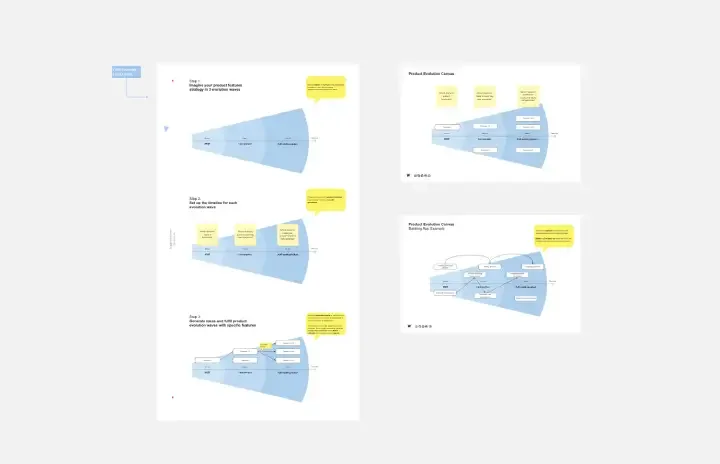
Product Evolution Canvas
Works best for:
Product Management, Planning
The Product Evolution Canvas template aids product managers in planning and executing product evolution strategies. By mapping out current product features, identifying areas for improvement, and setting evolution goals, this template guides product evolution efforts. With sections for analyzing user feedback, prioritizing enhancements, and tracking progress, it facilitates iterative product development and enhancement cycles. This template serves as a roadmap for evolving products to meet evolving customer needs and market demands.
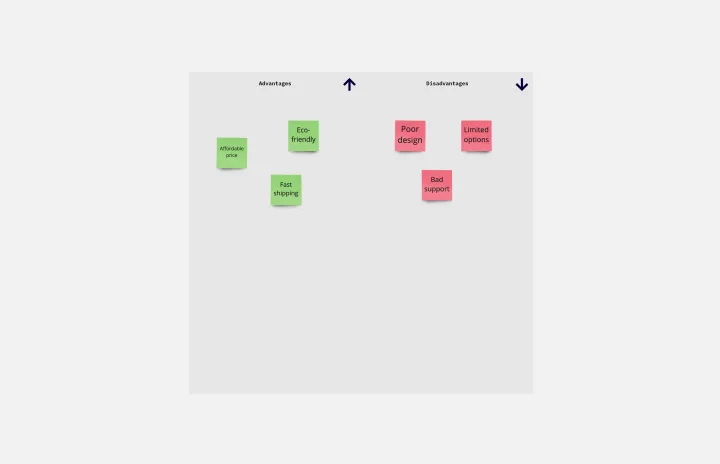
T-Chart Template
Works best for:
Ideation, Operations, Strategic Planning
T-Charts can help you compare and contrast two different ideas, group information into different categories, and prove a change through “before” and “after” analysis. T-Charts are visual organizational tools that enable you to compare ideas, so you can evaluate pros and cons, facts and opinions, strengths and weaknesses, or big-picture views versus specific details. Designers and content creators can use T-Charts to turn possibilities into actionable ideas. T-Charts are useful for discussing differences and similarities with your team or clients and can help you to reach a decision together.
Product Launch Lifecycle
Works best for:
Product Management, Planning
The Product Launch Lifecycle template guides product managers through the stages of launching new products. By outlining pre-launch, launch, and post-launch activities, this template ensures comprehensive product launch planning and execution. With sections for defining launch objectives, identifying target audiences, and tracking performance metrics, it facilitates coordinated efforts across marketing, sales, and product teams. This template serves as a roadmap for successful product launches, maximizing market impact and customer adoption.
Cisco Data Network Diagram Template
Works best for:
Software Development
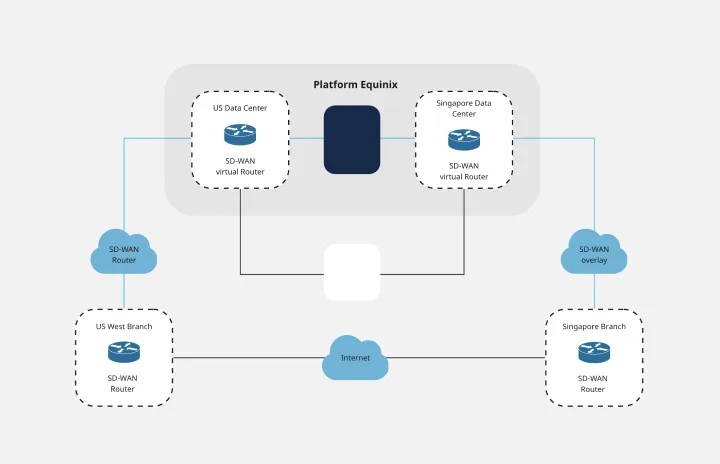
Cisco offers data center and access networking solutions built for scale with industry-leading automation, programmability, and real-time visibility. The Cisco Data Network Diagram uses Cisco elements to show the network design of Cisco Data Networks visually.