T-Chart Template
Make better, faster decisions by organizing and comparing your ideas.
Trusted by 65M+ users and leading companies


About the T-Chart Template
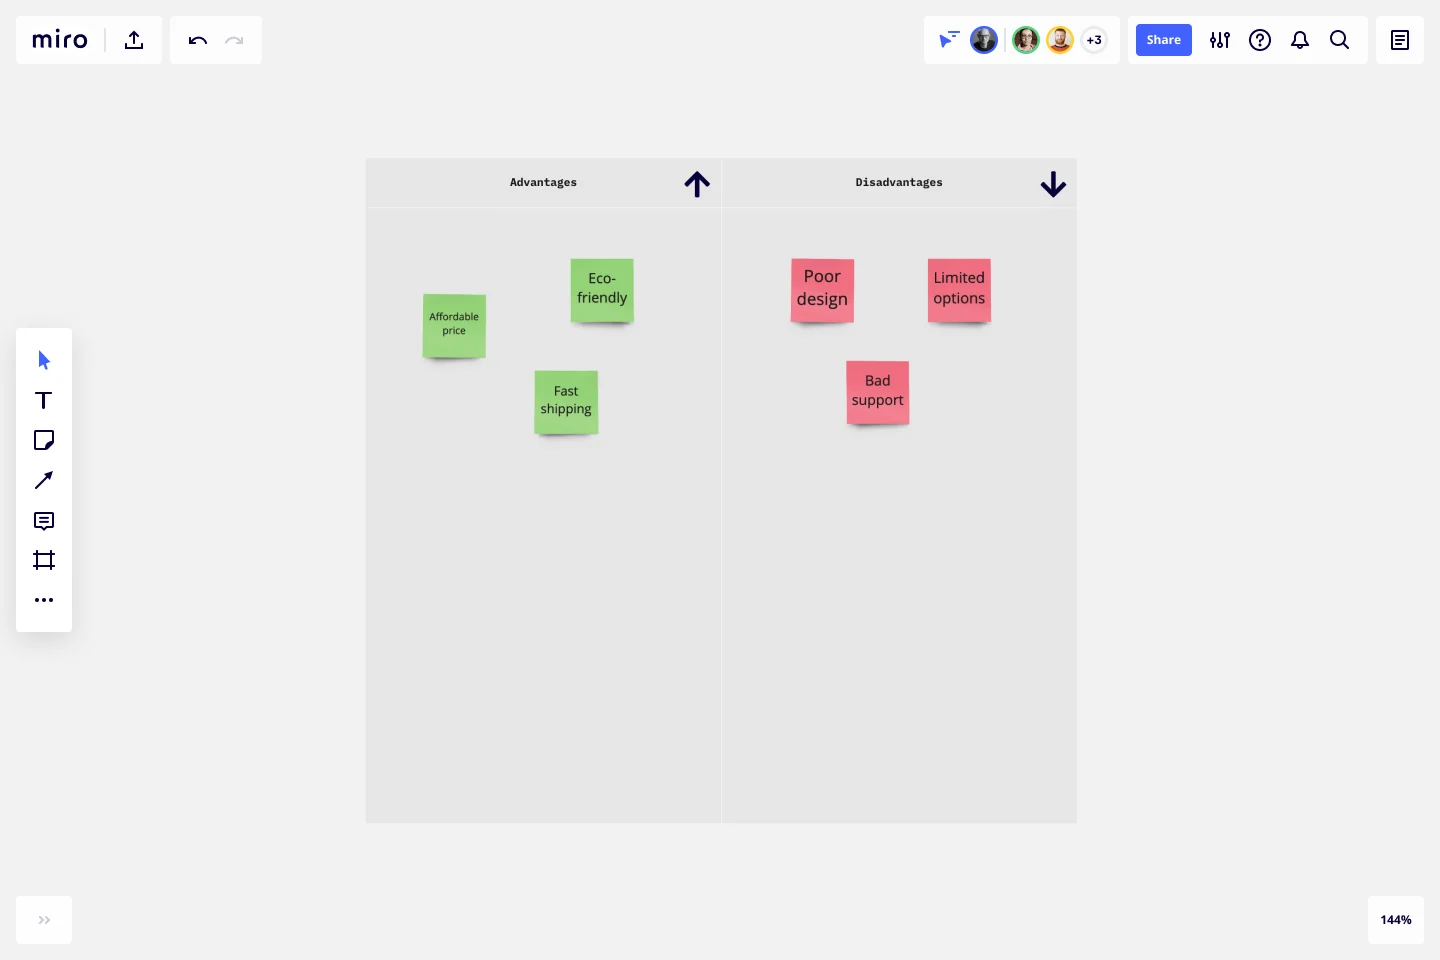
T-Charts can help you compare and contrast two different ideas, group information into different categories, and prove a change through “before” and “after” analysis. Designers and content creators can use T-Charts to turn possibilities into actionable ideas.
What is a T-Chart
T-Charts are a visual organizational tool that can help problem solve and compare aspects of two ideas. You can make comparisons such as pros and cons, facts and opinions, strengths and weaknesses, or big-picture views versus specific details.
When to use a T-Chart
T-Charts are useful for discussing differences and similarities with your team or clients and can help you to reach a decision together. Try testing out different headings or themes depending on the kind of problem you’d like to solve. This can include:
Compare pros and cons
Analyze personality traits
Contrast before and after states
Define cause and effect
Compare then and now states
Build a glossary to keep track of words and definitions
Outline hypothetical solutions and their potential outcomes
T-Charts allow your team to record new insights, spot patterns, and share knowledge. T- Charts often complement statistical data and graphs that can be presented with a formed narrative.
Create your own T-Chart
Making your own T-Charts is easy. Miro is the perfect canvas to create a T-chart and share them. Get started by selecting the T-Chart Template, then take the following steps to make one of your own:
Decide why you need a T-Chart. Are you comparing and contrasting design or content-related ideas to make a decision? Or outlining situations to plan ahead of important events? Either way, thinking ahead can create a strong foundation for your chart.
Invite your team or clients to fill in the blanks. Up to 300 people can collaborate seamlessly on your Miro board. If you need input or feedback to narrow down your ideas, invite others to participate.
Add visuals to strengthen your text, or make a final decision. Adding emojis or photos will bring an emotional layer or more context for your team. You can use imagery as a tool to vote for a preferred option. Imagery can also help bring the chart to life with real-life references.
Get started with this template right now.
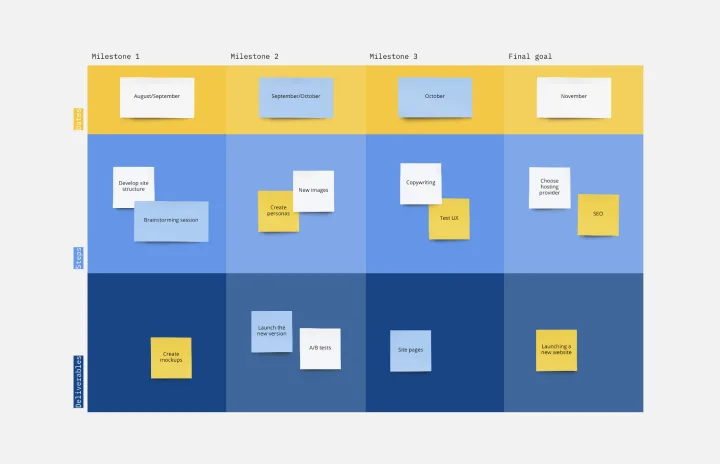
Milestone Chart Template
Works best for:
Project Management, Strategic Planning, Project Planning
When your team is collaborating on a large project, keeping track of the many tasks and multiple timelines can be a challenge. That’s why you need a milestone chart. These visual representations of important project events will make it simple for your team to stay on schedule and reach goals on time. And it’s so easy to get started — just determine the major milestones, use our template to create a milestone chart, and define the key dates and deliverables each milestone will require.

Daily Stand-up Meeting Template
Works best for:
Agile Methodology, Meetings, Software Development
The entire team meets to review the day before and discuss the day ahead. These daily meetings, also known as “scrums,” are brief but powerful — they identify roadblocks, give each team member a voice, foster collaboration, keep progress on track, and ultimately keep teams working together effectively. This template makes it so easy for you to plan daily standups for your sprint team. It all starts with picking a date and time, creating an agenda, and sticking with the same format throughout the sprint.
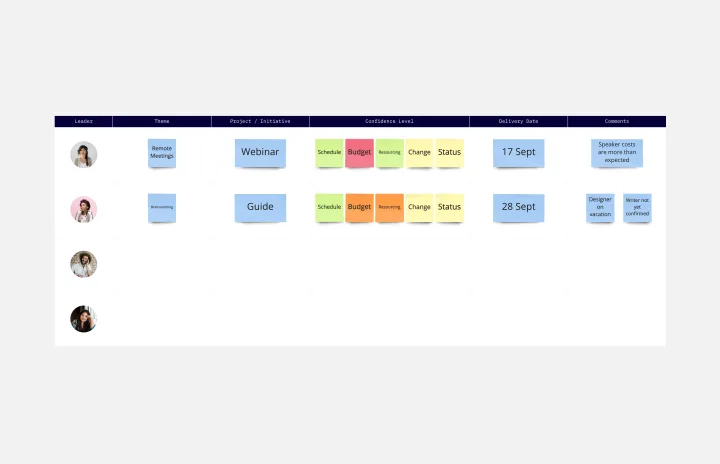
Status Report Template
Works best for:
Project Management, Documentation, Strategic Planning
A status report provides a snapshot of how something is going at a given time. You can provide a status report for a project, a team, or a situation, as long as it emphasizes and maps out a project’s chain of events. If you’re a project manager, you can use this report to keep historical records of project timelines. Ideally, any project stakeholder should be able to look at a status report and answer the question, “Where are we, and how did we get here?” Use this template as a starting point to summarize how something is progressing against a projected plan or outcome.
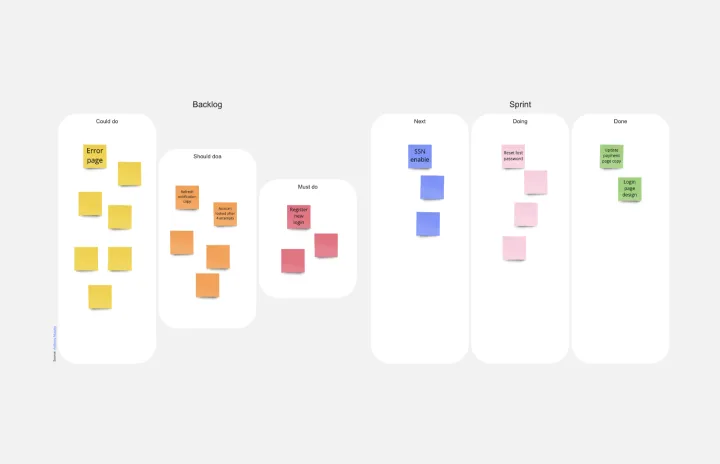
Idea Funnel Backlog
Works best for:
Design, Brainstorming, Agile Workflows
An Idea Funnel Backlog enables you to visualize your backlog and restrict the number of backlogged items at the top. In doing sos, you can prioritize items on your list without having to engage in unnecessary meetings or create too much operational overhead. To use the Idea Funnel Backlog, break up the funnel into different phases or treat it like a roadmap. Use the Idea Funnel Backlog as a hybrid model that combines your roadmap and backlog into one easily digestible format.
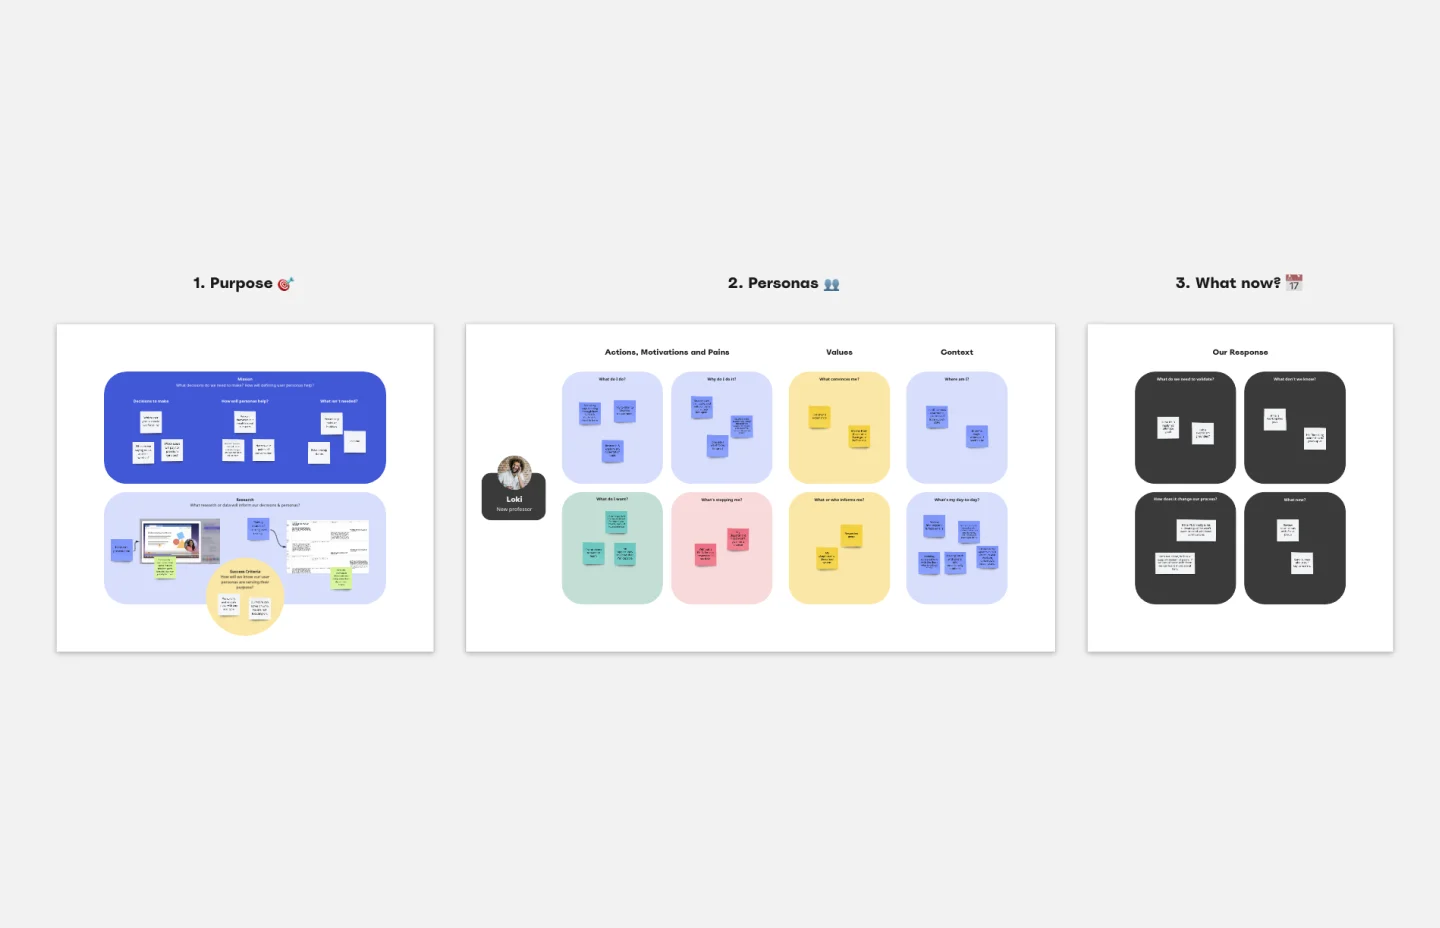
User Persona Template
Works best for:
Marketing, Desk Research, User Experience
A user persona is a tool for representing and summarizing a target audience for your product or service that you have researched or observed. Whether you’re in content marketing, product marketing, design, or sales, you operate with a target in mind. Maybe it’s your customer or prospect. Maybe it’s someone who will benefit from your product or service. Usually, it’s a whole collection of personalities and needs that intersect in interesting ways. By distilling your knowledge about a user, you create a model for the person you hope to target: this is a persona.
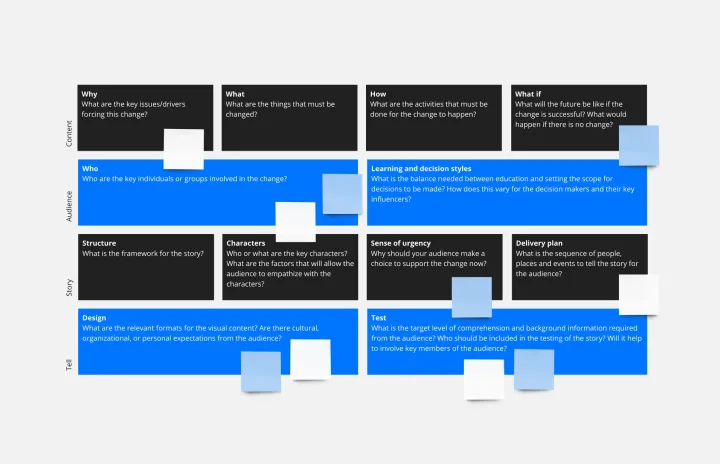
Visual Story Map Template
Works best for:
Marketing, Desk Research, Mapping
Some people like to think of a visual story map as a stylized to-do list, but it’s a lot more powerful than that. Visual story mapping allows your product management team to visualize multiple dimensions of information.