Milestone Chart Template
Track each project using this milestone template, both on a visual timeline and on a static chart. Use this milestone diagram to plan out significant events scheduled to happen at specific times within the project.
Trusted by 65M+ users and leading companies


About the Milestone Chart Template
A milestone chart is a visual representation of important events, known as milestones, planned in a project’s timeline. Milestone charts show one milestone per vertical line, with a description on the left-hand side of the milestone, and a horizontal timescale for the whole project.
When to use a milestone chart
Anytime your team collaborates on a large project with multiple tasks and deadlines, you can use a milestone chart. You may also find it useful to share the milestone chart with your managers or customers to update them on your progress and the likelihood of meeting your overall deadline.
Benefits of using a milestone chart
Unless your team tracks your milestones, you have no way of knowing whether you’re getting closer to your destination. By deciding on and tracking key milestones for your project, you can stay on schedule and reach your goals on time.
How to create a milestone chart
If your project has been planned or is in the process of being planned, here’s how to create a simple but effective milestone chart.
Step 1: Determine major milestones
For project managers and stakeholders, it can be difficult to parse out milestones from tasks. Milestones are distinct because they signify shifts in a project’s development. Think of them as road signs that help you stay on the right path as you work to complete a project.
To decide on a milestone, you might find it helpful to ask the following questions:
Does this task impact our deadline?
Is this a task or a deliverable?
Will this point in the project signify significant forward progress?
Does this task need to be reviewed by stakeholders?
If this task doesn’t get done, can we still complete the project?
Step 2: Create a milestone chart from a template
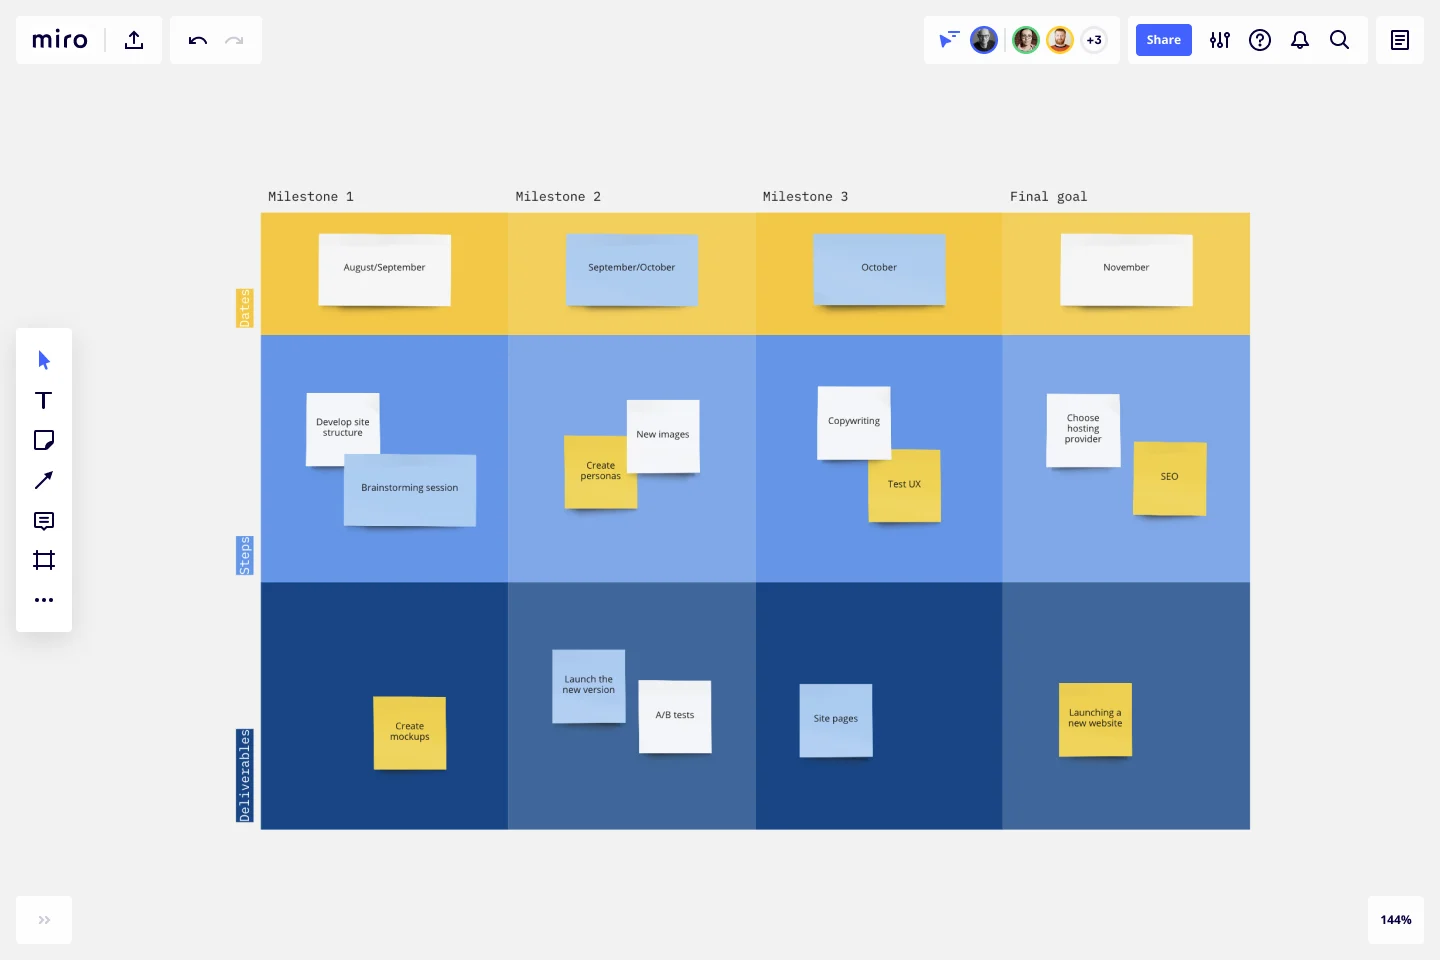
Miro is the perfect tool to create and share your milestone chart. Get started by selecting this milestone chart template. Use our simple template to visually track the smaller steps within a large project. For each milestone, we’ve pre-populated the template with several columns; as well as rows to track deadlines, steps, and deliverables. Then, customize the template to fit the needs of your particular project.
Step 3: Track each major milestone as a column
In our milestone chart template, each column is for a unique milestone. Once created, you can customize the milestone chart by adding as many columns for unique milestones as you need to. Remember, be careful to distinguish between major milestones and minor tasks. The number of milestones you chose to track will vary by project type and size, but it’s generally helpful to isolate only the most important milestones.
Step 4: Define dates, steps, and deliverables
The first row of a milestone chart is dedicated to displaying the date or dates that the particular milestone is expected to be completed. These can be specific dates, or time ranges depending on your need.
The second row of the milestone chart is for the high-level steps that need to be completed in order for the milestone to be reached. These don’t need to be very granular to avoid cluttering the chart.
The third row of the milestone chart is for specific deliverables. Ideally, these deliverables will be used to measure whether or not the milestone has been reached. Take the time to make sure these deliverables account for all major indicators of your milestone completion.
Step 5: Customize and track
Milestone charts are by design customizable for the specific project's needs. As a project progresses, you may find the need to make changes to accommodate for unforeseen problems. Keep track of each milestone’s progress, and make sure to collaborate regularly with your team on new developments.
What is the typical format of a Milestone Chart?
Track each project milestone, both on a visual timeline and on a static chart, with this detailed project milestone template. Identify who is assigned to each task, the status of each task, and any comments that accompany those tasks. Use the status key to see which tasks have yet to be started, which are on hold, and which are in progress.
How do you use a milestone chart?
Map out your project and each individual task across a predetermined timeline with this project timeline with milestones template. Show each task across a certain timeline, such as by month, quarter, or year, so you can get an accurate portrayal of the work left to be completed. Point out specific milestones that your team needs to hit in order to maintain the project timeline.
Get started with this template right now.
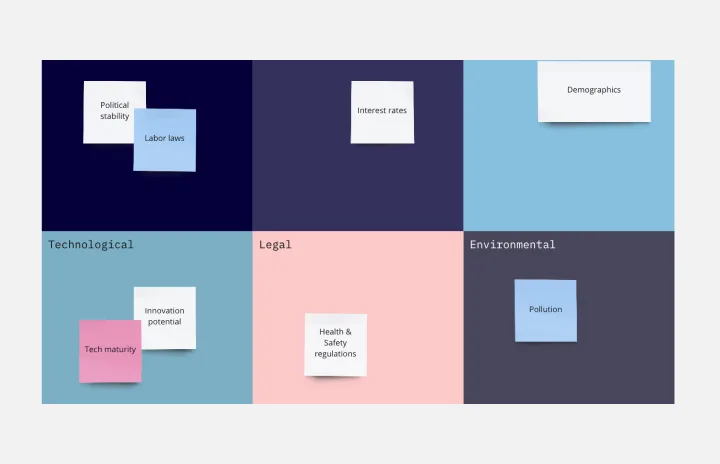
PESTLE Analysis Template
Works best for:
Ideation, Strategic Planning, Business Management
Want to keep your company secure and performing soundly? You have to first know how you’ll be affected by outside elements and factors — especially those that are political, economic, social, technological, legal and environmental in nature. A PESTLE Analysis helps you identify them and prepare for them. With this easy-to-use template, you can conduct a PESTLE Analysis, then use the results to shape your strategic planning, budget allocation, marketing, product updates, and organizational change initiatives.

Daily Stand-up Meeting Template
Works best for:
Agile Methodology, Meetings, Software Development
The entire team meets to review the day before and discuss the day ahead. These daily meetings, also known as “scrums,” are brief but powerful — they identify roadblocks, give each team member a voice, foster collaboration, keep progress on track, and ultimately keep teams working together effectively. This template makes it so easy for you to plan daily standups for your sprint team. It all starts with picking a date and time, creating an agenda, and sticking with the same format throughout the sprint.

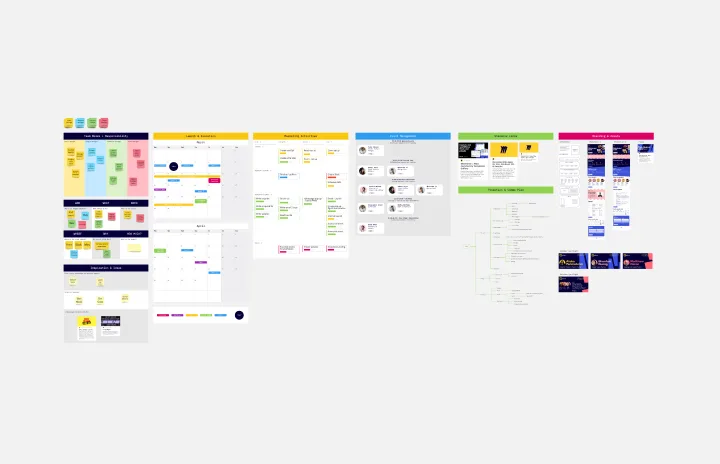
PI Planning Template
Works best for:
Agile Methodology, Strategic Planning, Software Development
PI planning stands for “program increment planning.” Part of a Scaled Agile Framework (SAFe), PI Planning helps teams strategize toward a shared vision. In a typical PI planning session, teams get together to review a program backlog, align cross-functionally, and decide on the next steps. Many teams carry out a PI planning event every 8 to 12 weeks, but you can customize your planning schedule to fit your needs. Use PI planning to break down features, identify risks, find dependencies, and decide which stories you’re going to develop.
Event Planning Template
Works best for:
Planning, Workshops
Whether you’re planning a product launch, fully remote conference, or milestone event, the Event Planning Template will act as a visual checklist and map for all the details you need to consider before the big day. The Event Planning Template is an adaptable way to make sure the creative and strategic vision of your event doesn’t get lost in the details. By mapping out different sections - from the marketing plan, to the agenda, to snacks and swag for guests — you and your team can focus on the details most important to your functions, and collaborate as needed when overlaps occur.
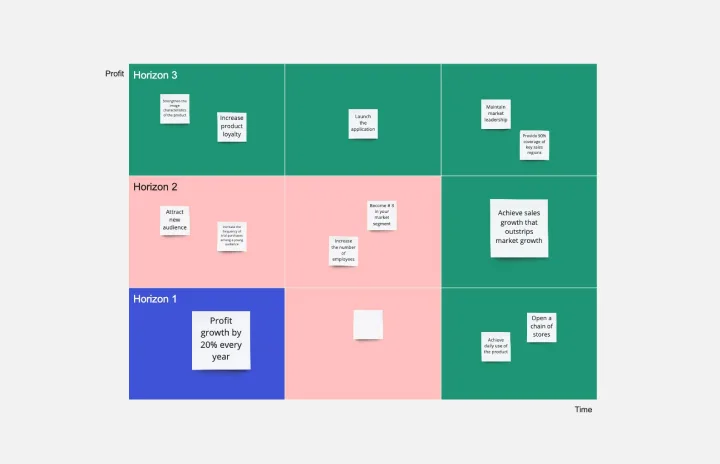
3 Horizons of Growth Template
Works best for:
Leadership, Strategic Planning, Project Planning
Featured in The Alchemy of Growth, this model gives ambitious companies a way to balance the present and the future—in other words, what’s working in the existing business and what emerging, possibly-profitable growth opportunities lie ahead. Then teams across the organization can make sure that their projects map to and support the organization’s goals. The 3 Horizons of Growth model is also a powerful way to foster a culture of innovation—one that values and depends on experimentation and iteration—and to identify opportunities for new business.
Block Diagram Template
Works best for:
Mapping, Software Development, Diagrams
Use this template to illustrate technical systems. Blocks represent important objects in the system, and arrows demonstrate how the objects relate to each other. Perfect for engineers, workflow managers, or anyone trying to build a better process.