Strategic Group Mapping Template
Easily define your competitive landscape using the Strategic Group Mapping Template. From understanding your product position to analyzing competitors, this template empowers anyone to visualize market competition seamlessly.
Trusted by 65M+ users and leading companies


About the Strategic Group Mapping Template
We know that in the complex landscape of business strategy, it's crucial to have tools that can simplify our processes and offer clarity. Enter Miro's Strategic Group Mapping Template - designed to help you visually represent the competitive positions of different companies or products in your market.
What's a Strategic Group Mapping Template?
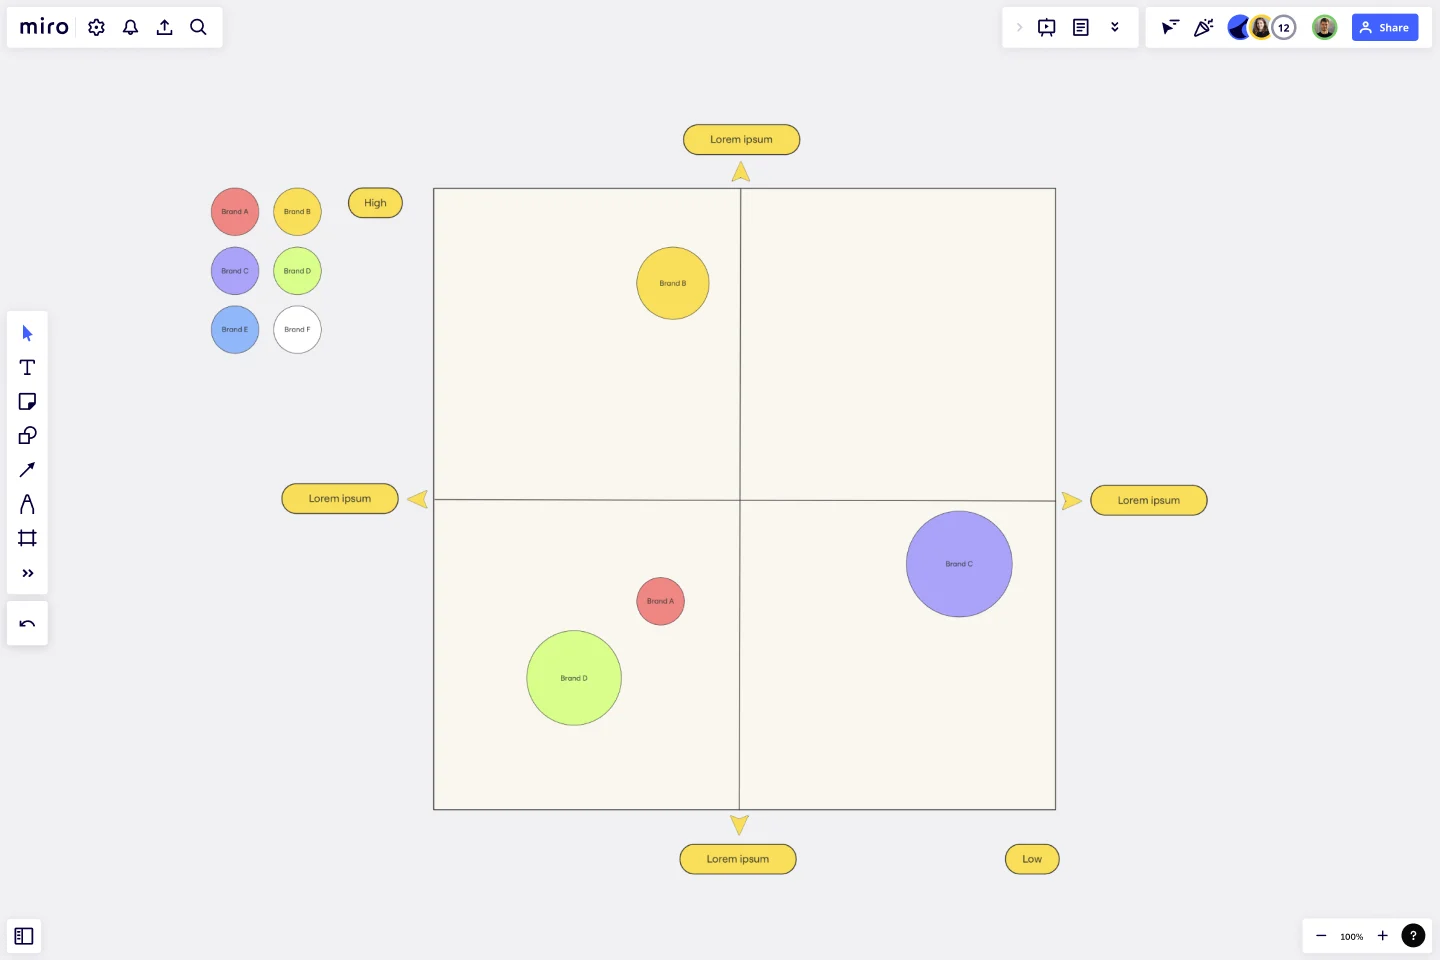
A Strategic Group Mapping Template is a visual tool that helps you plot out the competitive position of various entities within a market based on specific criteria. You can gain insights into market positions, potential market spaces, and competition intensity by placing competitors into different strategic groups based on key dimensions such as price range or product quality.
What are the benefits of using a Strategic Group Mapping Template?
Visual representation: By mapping competitors on a visual workspace, businesses can quickly identify clusters of similar competitors and gaps in the market.
Informed decision-making: It provides a clearer picture of where your business stands, aiding in more strategic decisions regarding market entry or product development.
Facilitates collaboration: As a shared template, teams can collaborate in real time, brainstorming and drawing insights together.
Enhances competitive analysis: Enables companies to identify potential threats or opportunities by visualizing where competitors are clustered and where market spaces are less dense.
How to use a Strategic Group Mapping Template in Miro?
Miro is flexible and interactive, making it a perfect place for strategic mapping. Here's how you can create one:
Open a new board: Select the Strategic Group Mapping Template in the Templates Library.
Use shapes: Edit the shapes on the template, or add more from Miro's shapes library. For your X and Y axis criteria, you can use lines and label them appropriately. Drag circles, rectangles, or other shapes to represent different companies or products.
Customize and position: Adjust the size, colors, and positions of shapes based on the relative position of competitors. The drag-and-drop feature ensures ease of positioning.
Collaborate: Invite team members to join your board and input their insights, ensuring a comprehensive mapping.
What criteria should I use for the axes on the map?
It varies by industry and what you're analyzing. Common criteria include price, quality, market share, product range, and geographical coverage.
How often should I update my strategic group map?
It's essential to update your map periodically, especially when there are significant market changes, new entrants, or shifts in competitor strategies.
Can multiple team members edit the map simultaneously?
Yes, Miro allows real-time collaboration, so multiple members can edit, comment, and brainstorm together on the same map.
Get started with this template right now.
Ecomap Template
Works best for:
Strategy & Planning, Diagramming
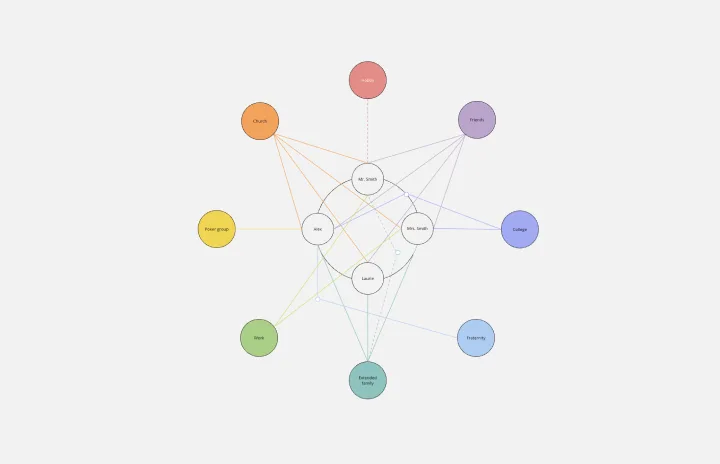
The Ecomap Template illustrates the multifaceted relationships and environmental interactions encircling an individual or entity. Determine crucial patterns and dynamics by providing a clear and comprehensive visualization of how different systems intertwine and influence each other.
Product Roadmap Template
Works best for:
Product Management, Roadmaps
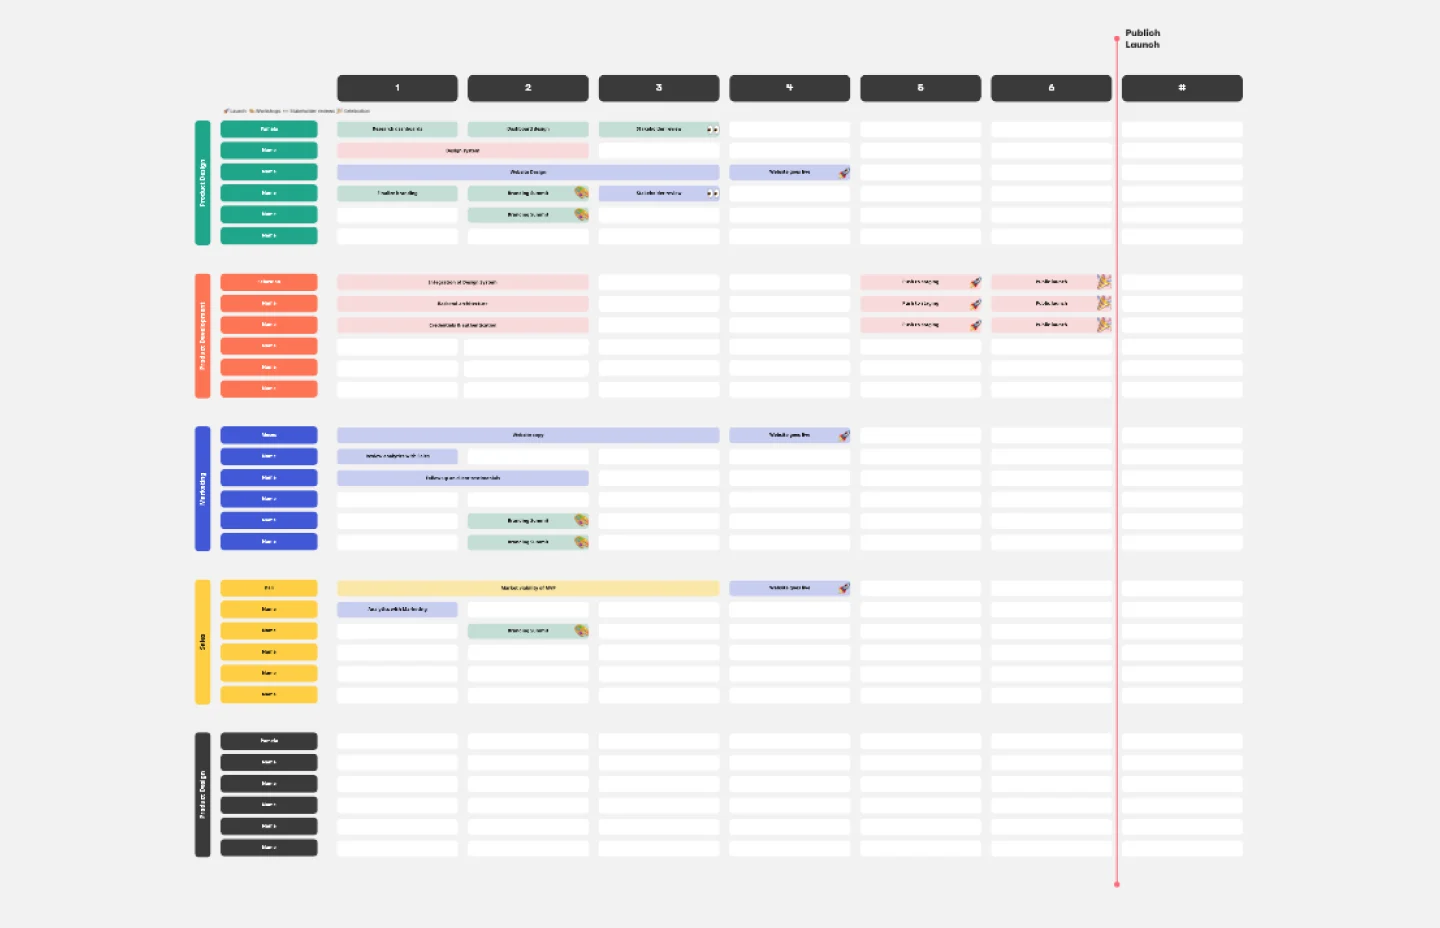
Product roadmaps help communicate the vision and progress of what’s coming next for your product. It’s an important asset for aligning teams and valuable stakeholders – including executives, engineering, marketing, customer success, and sales – around your strategy and priorities. Product roadmapping can inform future project management, describe new features and product goals, and spell out the lifecycle of a new product. While product roadmaps are customizable, most contain information about the products you’re building, when you’re building them, and the people involved at each stage.
[Triple Diamond] Project Map
Works best for:
Roadmap, Mapping, Planning
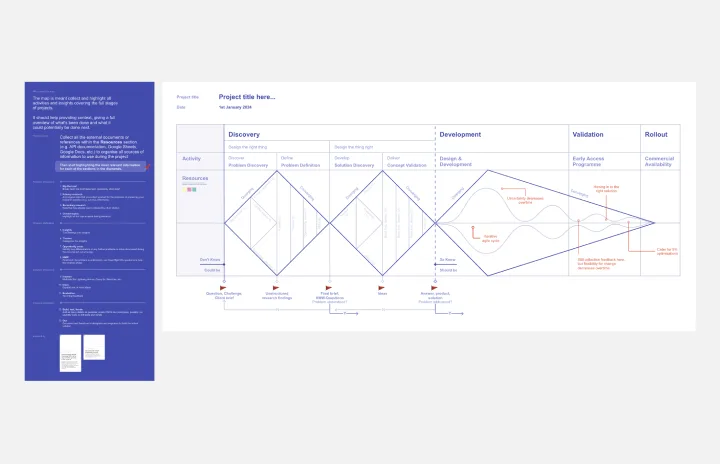
The [Triple Diamond] Project Map template provides a comprehensive framework for managing project initiatives from inception to delivery. By guiding teams through the stages of discovery, definition, and delivery, this template ensures alignment with stakeholder expectations and project objectives. With a focus on user-centric design and iterative development, teams can deliver high-quality solutions that meet user needs and drive business value.
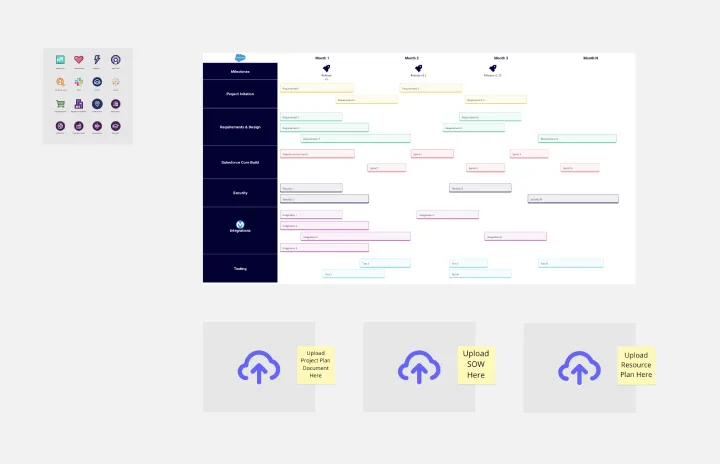
Salesforce Implementation Plan
Works best for:
Roadmap, Planning, Mapping
The Salesforce Implementation Plan template offers a structured framework for planning and executing Salesforce deployment projects. By outlining key milestones, tasks, and dependencies, teams can ensure a smooth transition to the Salesforce platform. This template facilitates collaboration between IT and business teams, ensuring that implementation efforts are aligned with strategic objectives and deliver value to stakeholders.
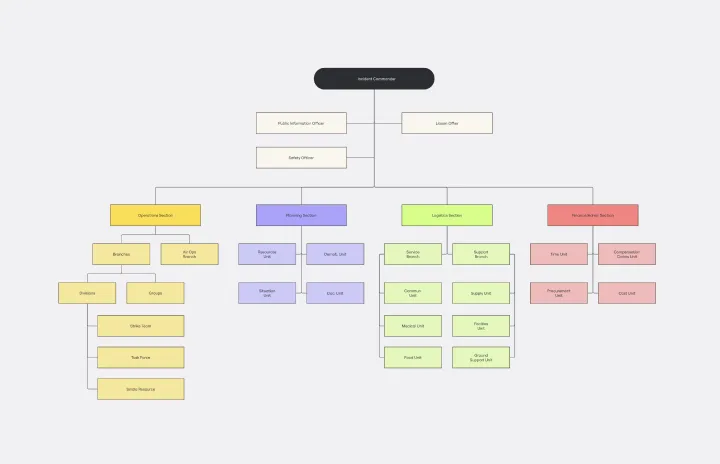
ICS Org Chart Template
Our carefully crafted ICS Org Chart Template is an invaluable tool designed to clearly represent the hierarchical structure of the Incident Command System (ICS). It simplifies the complex web of roles, responsibilities, and chains of command within the ICS, providing a structured blueprint for both experienced professionals and those new to the system. The template's most notable benefit is its ability to foster immediate understanding, bridging the gap between intricate organizational structures and the teams navigating them. Teams that use this template can ensure that everyone is aligned, understands their role, and collaborates efficiently, thereby reducing potential bottlenecks and misunderstandings.
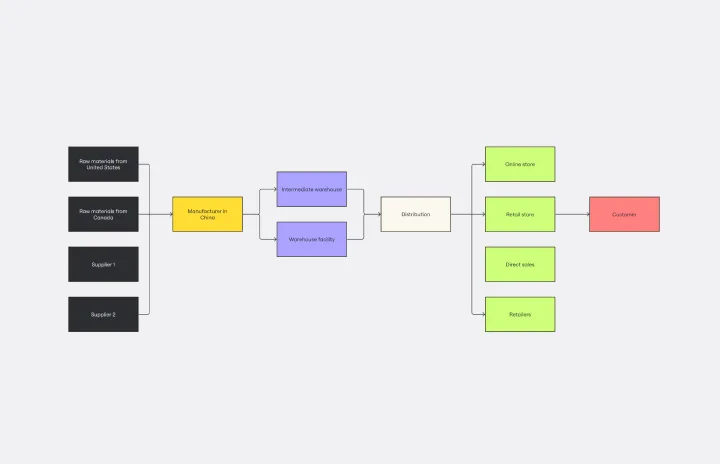
Supply Chain Diagram Template
Works best for:
Diagramming
The Supply Chain Diagram Template is great for businesses to streamline and enhance their supply chain processes. This template lets you visualize the entire supply chain, from sourcing raw materials to delivering finished products. Its intuitive layout simplifies complex networks, making identifying key areas and potential bottlenecks easier. One of the standout benefits of using this template is its clarity. It bridges the gap between complex processes and strategic decision-making by presenting a clear, visual supply chain representation. This clarity enables teams to pinpoint inefficiencies and implement more effective management strategies, which optimizes operations and facilitates better communication and understanding across different departments within an organization.