Wardley Mapping Canvas Template
Build an intuitive understanding of your business context.
Trusted by 65M+ users and leading companies


About the Wardley Map template
What is a Wardley Map?
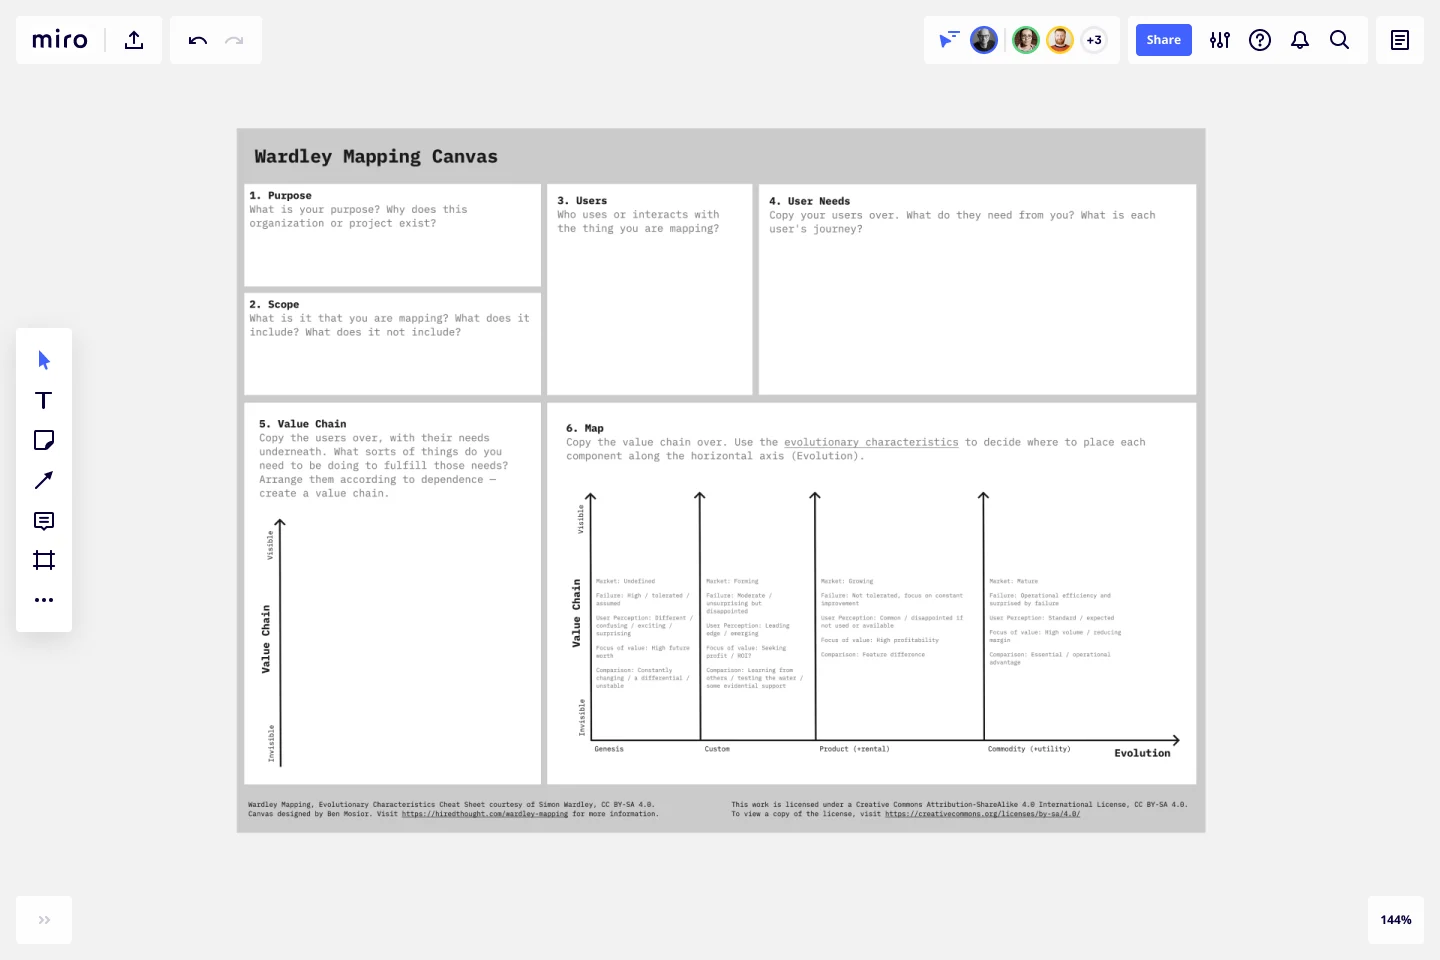
A Wardley Map was developed to map the structure of a business, understand its context, and better serve users. You place components with value on the y-axis and commodity on the x-axis.
Every organization operates within a landscape that contextualizes and influences your decisions. To build a Wardley Map, you must illustrate that landscape as a value chain. What’s a value chain? It’s a series of activities or elements that are required to meet a user’s needs. You categorize each element of the value chain according to their stage of evolution compared to the competition. The resulting Wardley Map describes your assumptions and intentions for anyone to read.
The goal of Wardley mapping is to build a shareable, scalable visualization of the landscape surrounding your business. It allows you to articulate your strategy while summarizing the landscape in a way that’s easy to understand. A Wardley Map is like a time capsule, capturing your understanding at a certain point in time and documenting it for the future.
Why use a Wardley Map?
Use a Wardley map to assess future scenarios, quickly validate solutions, and develop a shared visual understanding of a business' context. Using a Wardley Map, you can significantly reduce a project's risk and avoid costly mistakes.
The benefits of using a Wardley Map
Benefit 1 - Enhance communication. Easily communicate your understanding of the landscape to your team, new hires, and stakeholders. Wardley Maps are powerful tools that can help get new employees up to speed quickly, so they can hit the ground running on day one.
Benefit 2 - Identify risks and opportunities. A Wardley Map clearly lays out the environment in which your product is operating, as well as the value chain that constrains it. This allows you to understand the challenges ahead and how can exploit market gaps.
Benefit 3 - Reduce costs. Wardley Maps help ensure everyone on your team is aligned, and that cross-functional partners share your understanding of the landscape. This alignment reduces costly errors and streamlines your processes.
Benefit 4 - Foster collaboration. Wardley mapping empowers you to minimize risk and conflict across your teams. Teams that engage in Wardley mapping report higher satisfaction, deeper understanding, and closer alignment on shared goals.
Get started with this template right now.
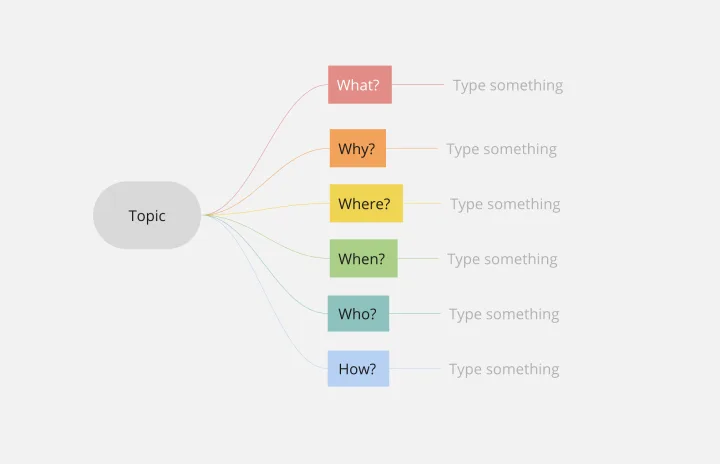
5W1H Template
Works best for:
Strategy & Planning
The 5W1H Template is a strategic framework that clarifies complex situations or projects into six foundational questions: What, Who, Where, When, How, and Why. This methodological approach ensures a comprehensive understanding, encouraging teams to dissect and explore every aspect of a given challenge or project.
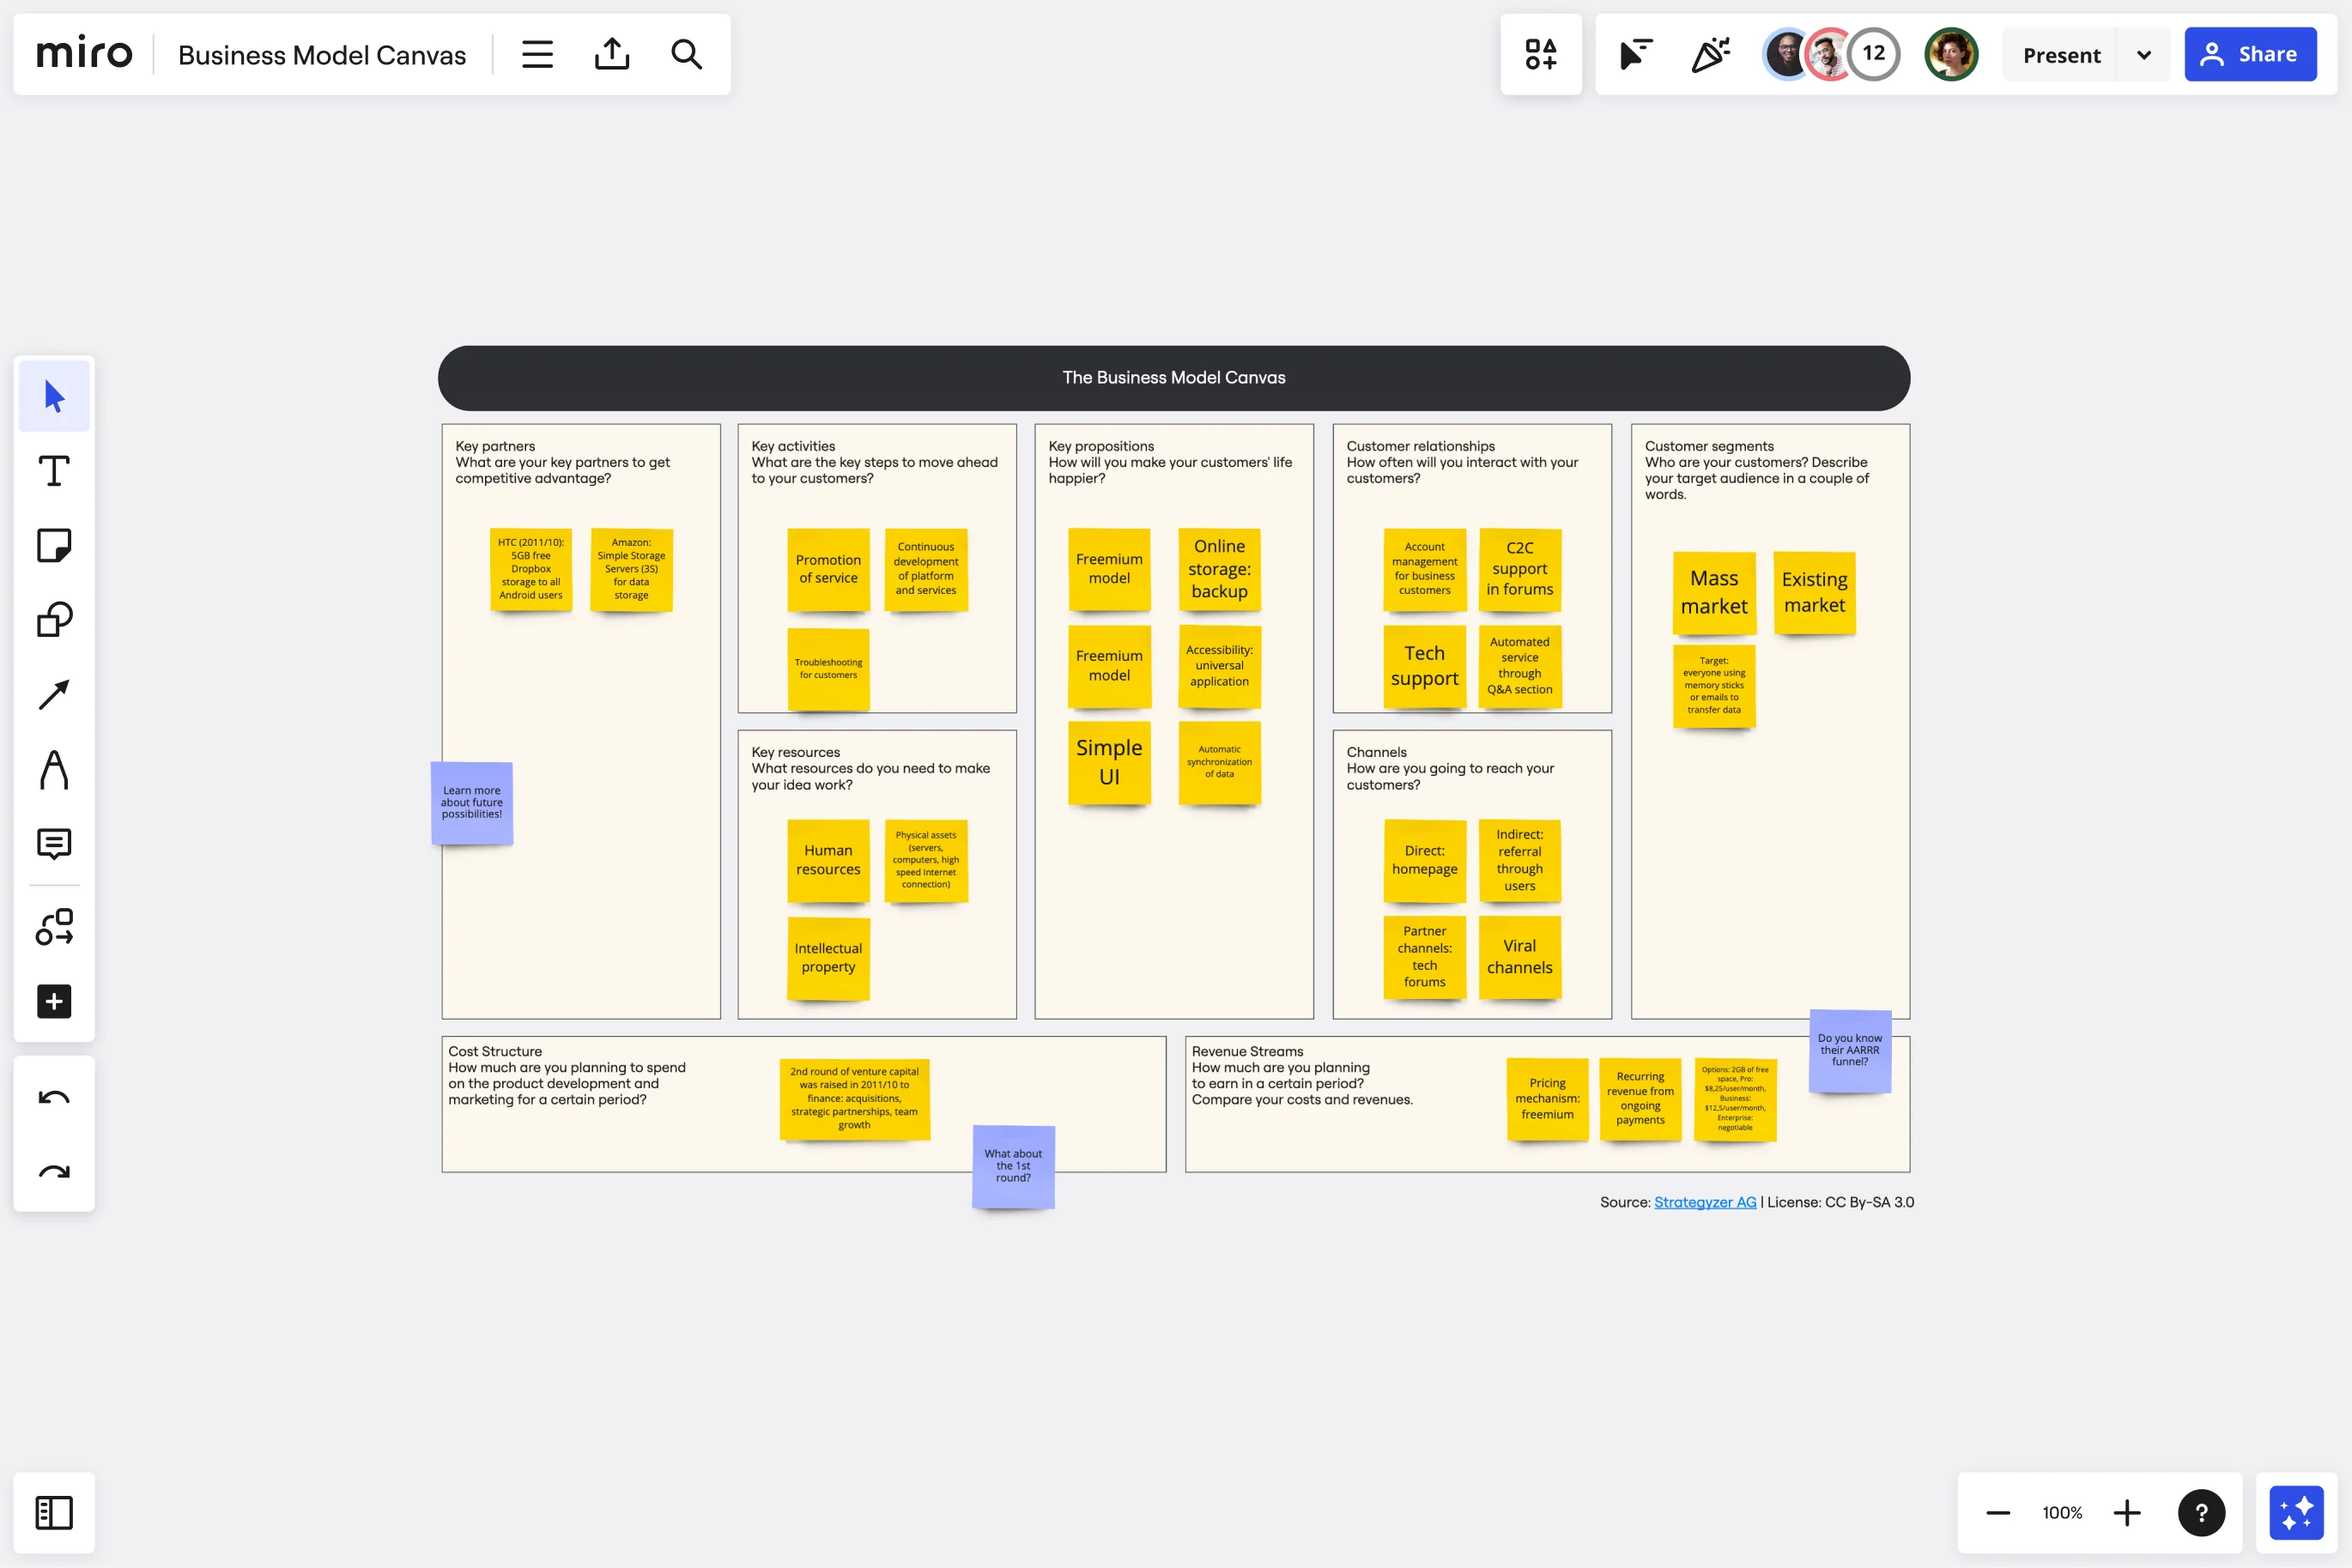
Business Model Canvas Template
Works best for:
Leadership, Agile Methodology, Strategic Planning
Your business model: Nothing is more fundamental to who you are, what you create and sell, or ultimately whether or not you succeed. Using nine key building blocks (representing nine core business elements), a BMC gives you a highly usable strategic tool to develop and display your business model. What makes this template great for your team? It’s quick and easy to use, it keeps your value proposition front and center, and it creates a space to inspire ideation.
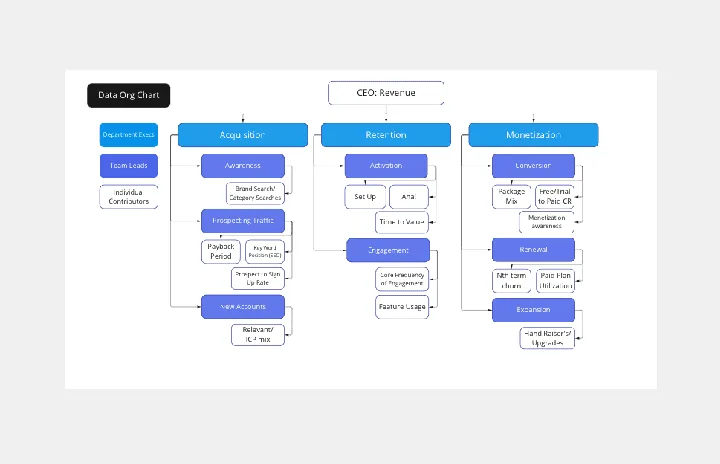
Data Org Chart
Works best for:
Org Charts, Operations, Mapping
Succeed with your data-driven culture by creating a data 'org chart'.
Product Positioning Template
Works best for:
Marketing, Product Management, Desk Research
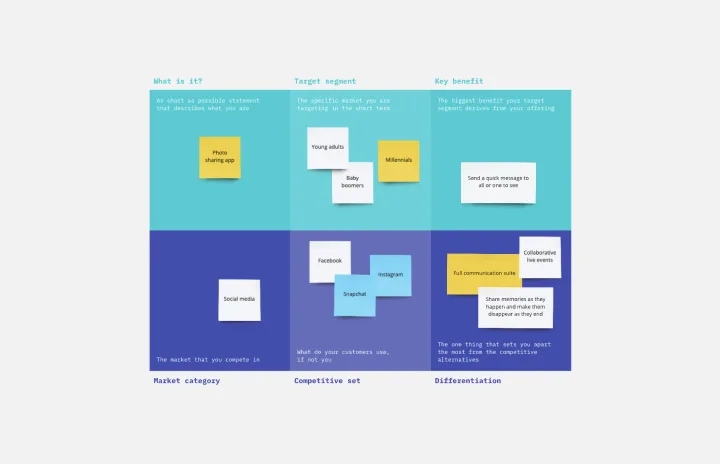
For better or for worse, your company’s chances for success hinge partially on your market. As such, before you start building products and planning strategies, it’s a good idea to conduct a product positioning exercise. A product positioning exercise is designed to situate your company and your offering within a market. The product positioning template guides you to consider key topics such as defining your product and market category, identifying your target segment and competitors, and understanding your key benefits and differentiation.
3-Circle Venn Diagram
Works best for:
Education, Diagrams, Brainstorming
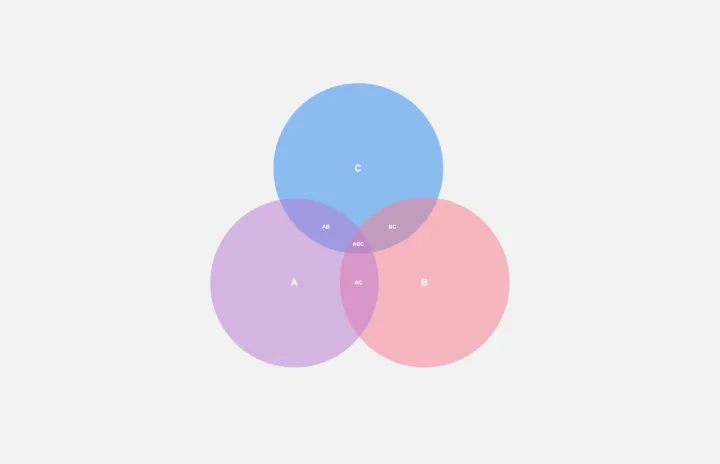
Venn diagrams have been a staple of business meetings and presentations since the 1800s, and there’s a good reason why. Venn diagrams provide a clear, effective way to visually showcase relationships between datasets. They serve as a helpful visual aid in brainstorming sessions, meetings, and presentations. You start by drawing a circle containing one concept, and then draw an overlapping circle containing another concept. In the space where the circles overlap, you can make note of the concepts’ similarities. In the space where they do not, you can make note of their differences.
Look Mock Analyze Template
Works best for:
Design, Desk Research, Product Management
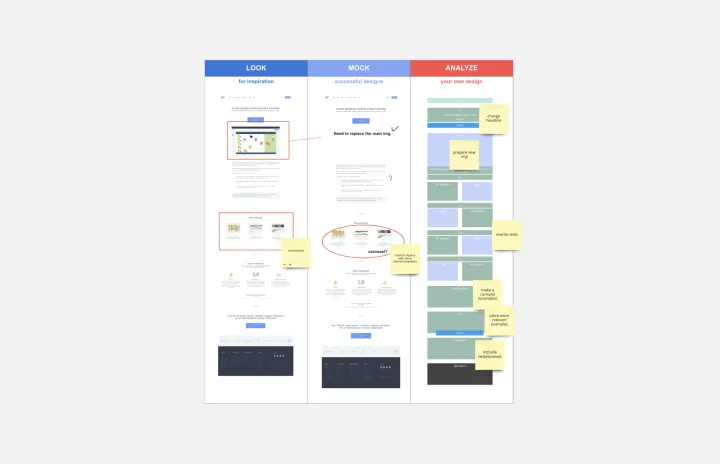
Doing your homework (aka, the research) is a key step in your design process, and the Look, Mock, Analyze approach helps you examine, structure, and streamline that step. With this powerful tool you’ll be able to identify your strengths and weaknesses, what you did right or wrong, and whether you spent time efficiently. Our Look, Mock, Analyze template makes it so easy for you to discover inspiration, mock up designs, and get feedback — you can start by setting up your board in less than a minute.