System Flowchart Template
Illustrate a system's framework and vital elements with the System Flowchart Template.
Trusted by 65M+ users and leading companies


About the System Flowchart Template
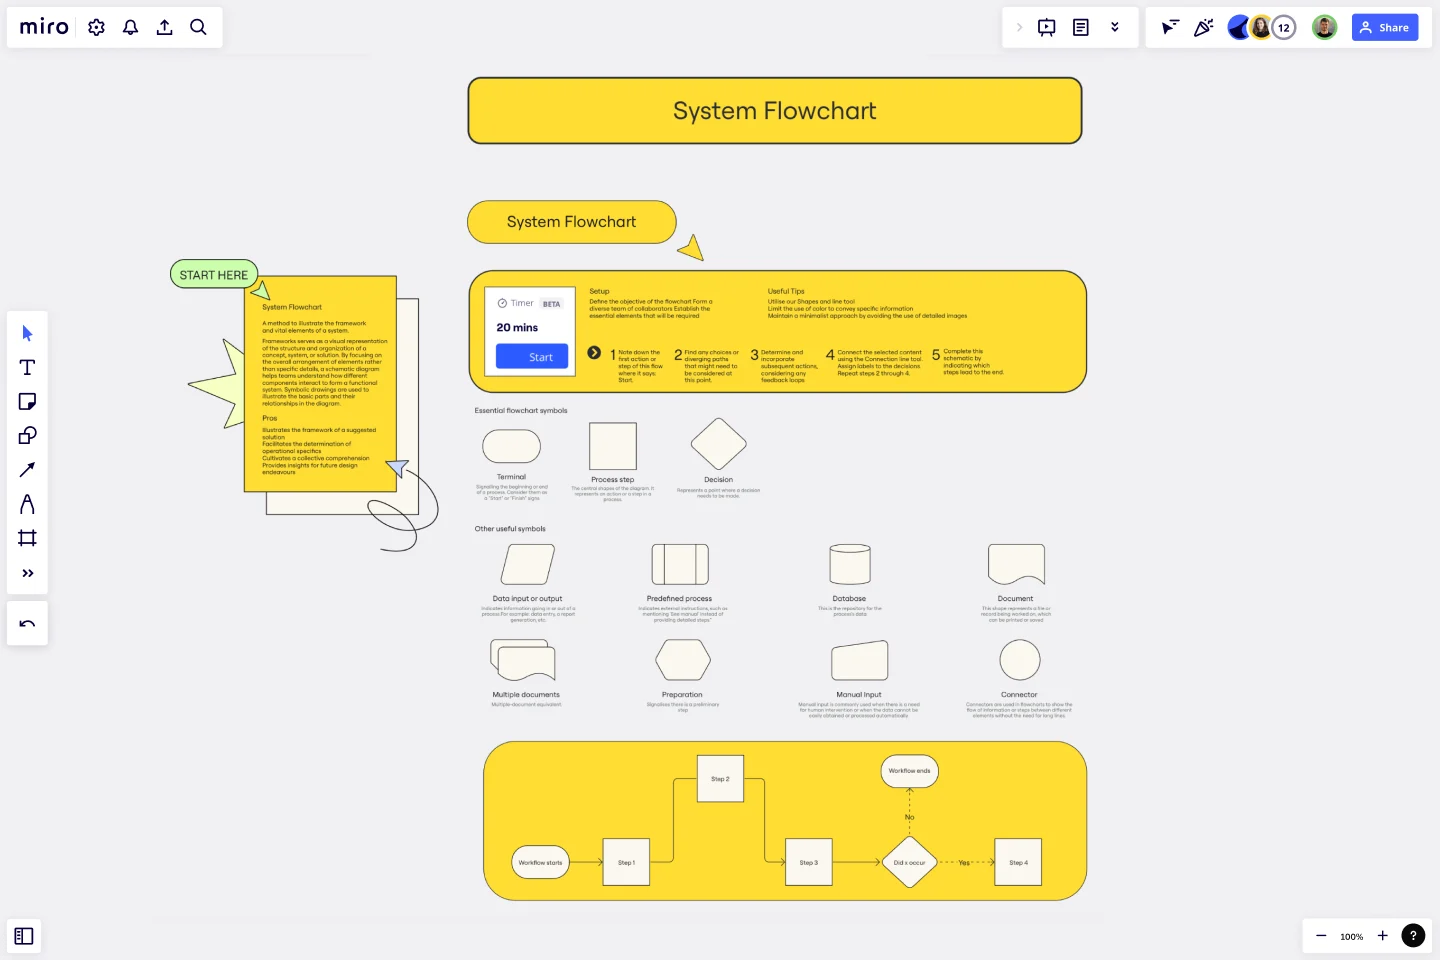
The System Flowchart Template visually represents the structure and organization of a concept, system, or solution. It provides a high-level view of the system by focusing on the overall arrangement of elements rather than specific details. It helps teams understand how different components interact to form a functional system.
Although these frameworks are frequently used in technical fields, they can also be utilized in non-technical fields to assist teams in comprehending complex concepts or processes. They provide a shared language and understanding of the system, which ensures that everyone is aligned and working towards the same objectives.
Benefits of using the template
Illustrate the framework of a suggested solution.
Facilitate the determination of operational specifics.
Cultivate a collective comprehension.
Provide insights for future design endeavors.
How to use the template in Miro
Note down this flow's first action or step where it says: Start.
Find any choices or diverging paths that might need to be considered at this point.
Determine and incorporate subsequent actions, considering any feedback loops.
Connect the selected content using the Connection line tool. Assign labels to the decisions. Repeat steps 2 through 4.
Complete this schematic by indicating which steps lead to the end.
Setup
Define the objective of the flowchart.
Form a diverse team of collaborators.
Establish the essential elements that will be required.
Useful tips
Utilize our Shapes and line tool.
Limit the use of color to convey specific information.
Maintain a minimalist approach by avoiding the use of detailed images.
Get started with this template right now.
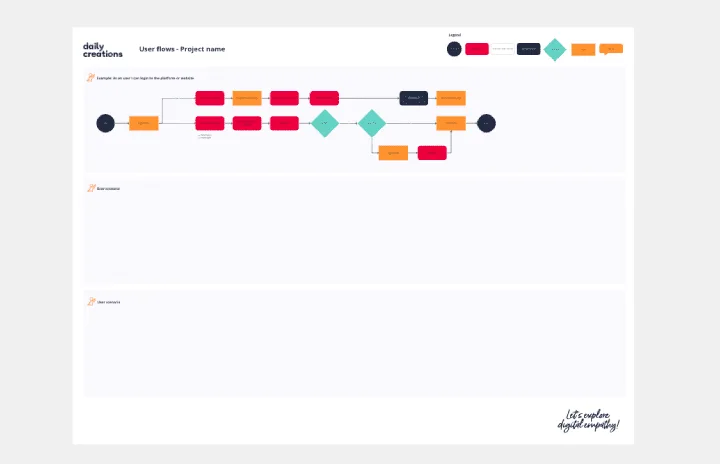
User Flows
The User Flows template offers a visual tool for mapping out the sequence of steps that users take to accomplish a specific task or achieve a goal within a digital product or service. It provides elements for documenting user interactions, screens, and decision points along the user journey. This template enables UX designers and product teams to understand user behaviors, identify pain points, and optimize the user experience effectively. By promoting user-centric design and empathy, the User Flows template empowers teams to create intuitive and engaging digital experiences that meet user needs and drive satisfaction.
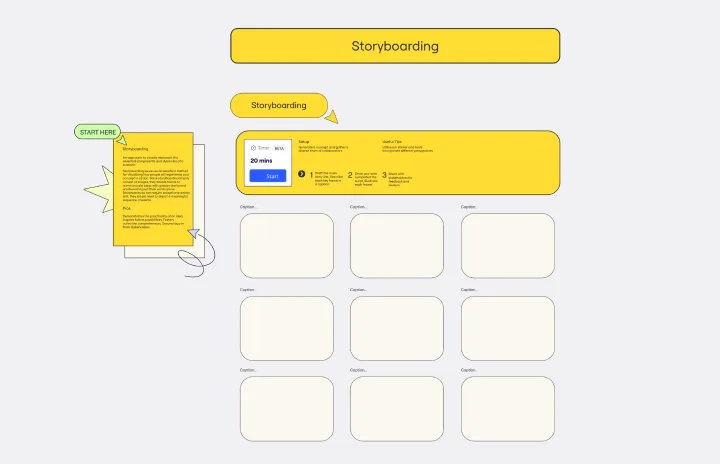
Storyboarding Template
The Storyboarding Template is an excellent way to visualize how people will experience your concept in action. It primarily consists of images, which enable teams to communicate ideas with greater clarity and emotional impact than words alone. You don't need exceptional artistic skill to create storyboards; you simply need to depict a meaningful sequence of events.
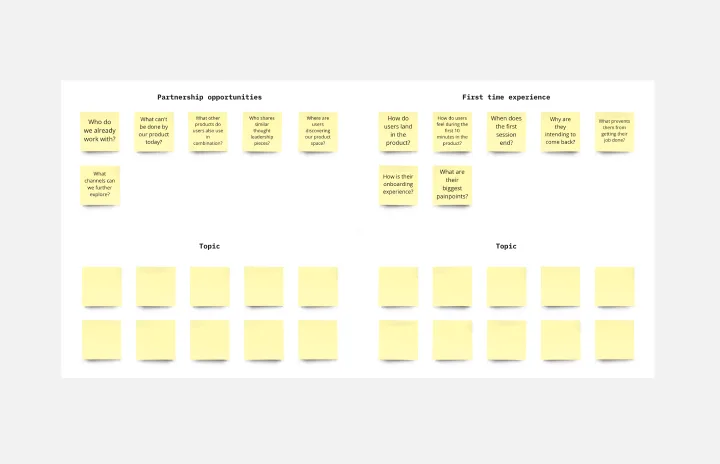
Research Topic Brainstorm Template
Works best for:
Desk Research, Brainstorming, Ideation
Coming up with a topic for a research project can be a daunting task. Use the Research Topic Brainstorm template to take a general idea and transform it into something concrete. With the Research Topic Brainstorm template, you can compile a list of general ideas that interest you and then break them into component parts. You can then turn those parts into questions that might be the focus for a research project.
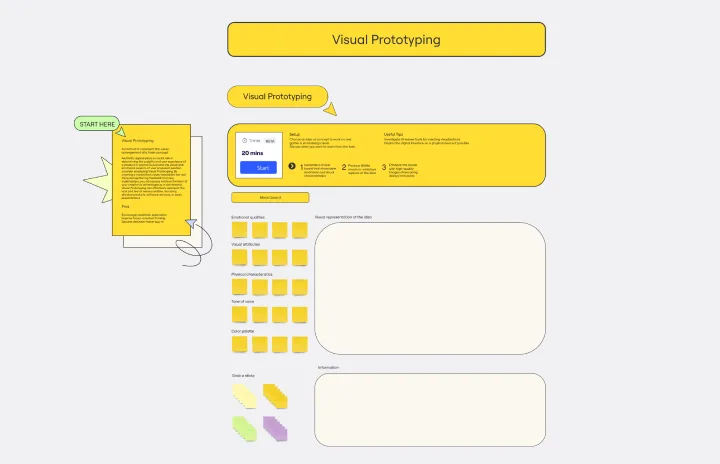
Visual Prototyping Template
Visual and emotional aspects play a vital role in determining a product or service's usability and user experience. To evaluate these aspects of your proposed solution, consider using the Visual Prototyping Template. By creating a model that closely resembles the real product or service, and gathering feedback from key stakeholders, you can assess whether the form of your creation is advantageous or detrimental.
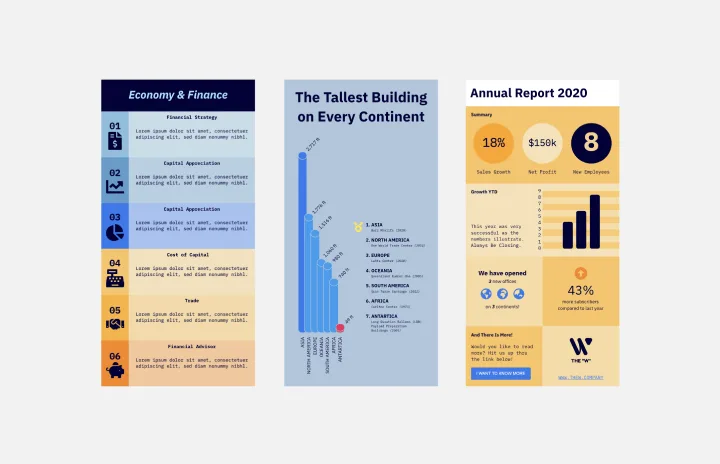
Infographic Template
Works best for:
Marketing, Desk Research, Documentation
As we bet you’ve experienced, data can get pretty dense and dry. But you need it to be compelling, memorable, and understandable. The solution? Infographics. These are tools that let you present information in a visually striking way and turn quantitative or qualitative data into stories that engage and resonate. Whoever you’ll be presenting to — customers, donors, or your own internal teams — our template will let you design an infographic that combines text and visuals to break down even the most complicated data.
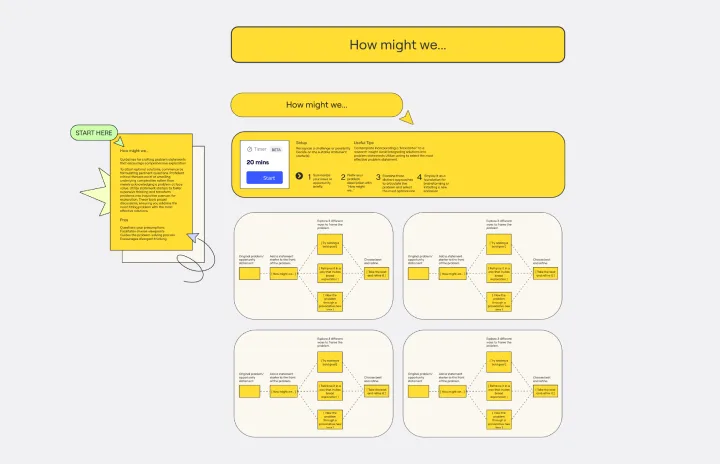
How Might We Template
It's crucial to ask the right questions to find the best solutions. Skilled critical thinkers can uncover the underlying complexities of a problem instead of just accepting it at face value. One way to encourage this type of thinking is by using statement starters, such as the How Might We Template. These tools can help you explore more open-ended problems and have more productive discussions, ultimately leading to the most effective solutions.