Production Flowchart Template
Map processes from start to finish and reduce complexity with the production flowchart template.
Trusted by 65M+ users and leading companies


About the Production Flowchart Template
Do you want to simplify your production processes? Use the production flowchart template to break down each step, visualizing the production flow and spot areas for optimization.
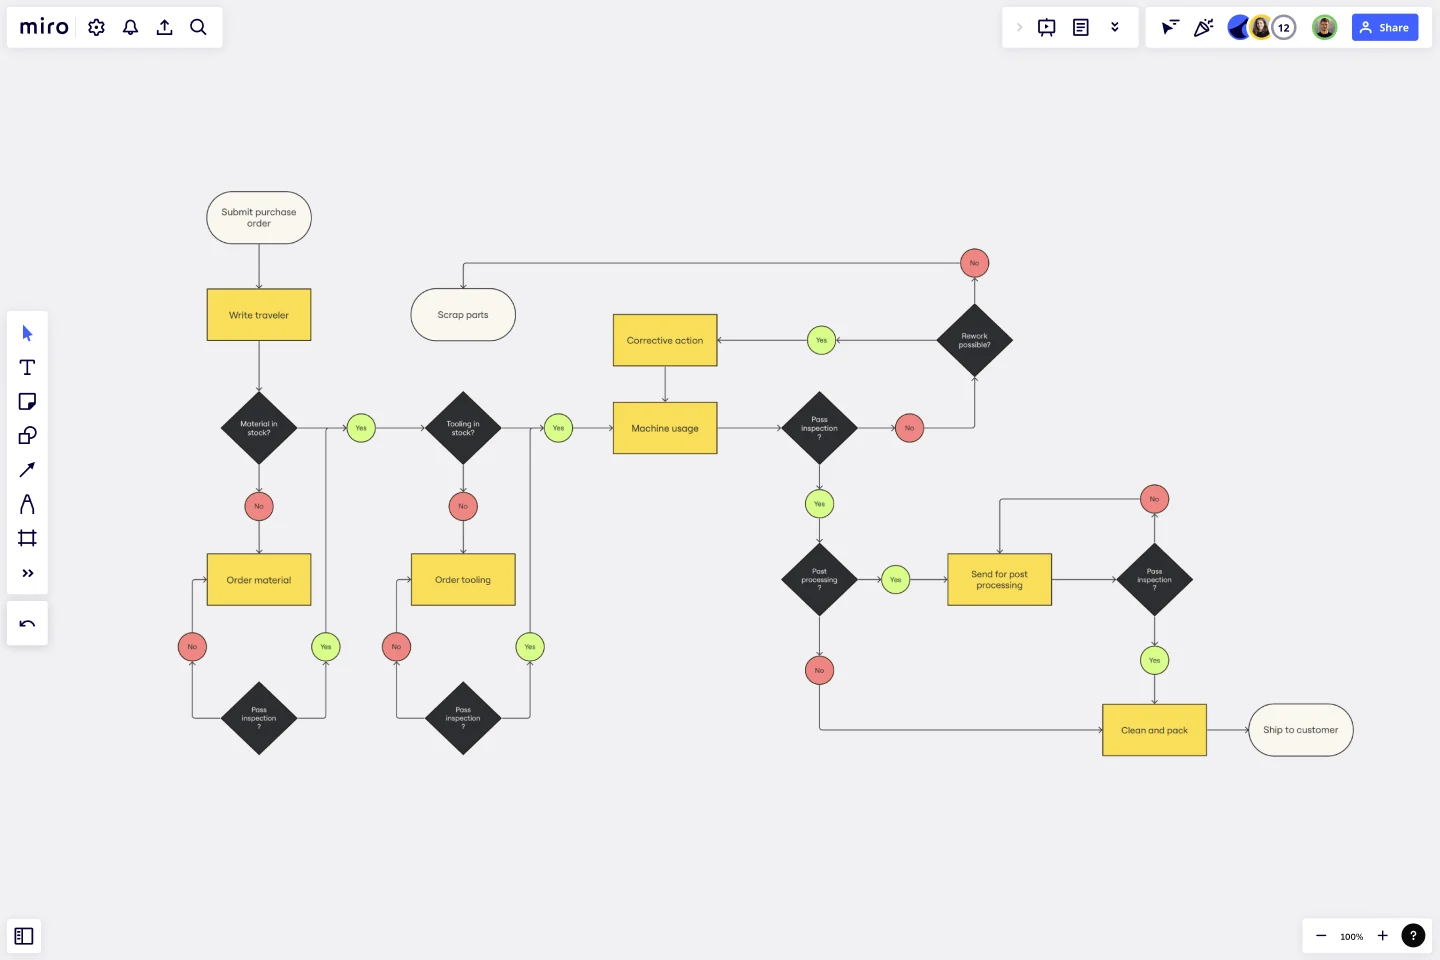
The template consists of a pre-designed diagram that showcases the systematic breakdown of the production process. Each area of the template signifies a distinct phase or step in the process, making it easier to understand the progression of tasks.
The production flowchart template contains the following attributes:
Shapes: These represent different steps or processes. They can be customized to differentiate tasks, departments, or stages.
Connector Lines: These link the shapes together, indicating the sequence or flow between tasks.
Annotations: Useful for adding extra information or context about a particular process or step.
Colors: Can be applied to shapes or lines to categorize or prioritize processes.
This template can be customized to meet the unique requirements of any production, making it the perfect solution for your needs.
How to use the production flowchart template in Miro
Add your production flow: Open the template and edit the shapes, colors, and texts to represent your production process.
Expand the flowchart: Use Miro’s automated diagramming features to add more shapes and connector lines until your production process is accurately represented.
Add any extra context: Integrate other artifacts or elements on the board to provide any additional context that helps visualize or understand your production process.
Why should you use a production flowchart template?
Breaking down a production process from start to finish makes it easy to visualize complex operations. In addition to serving as a useful guide, this template has many benefits:
Provides clarity: A detailed flowchart provides a clear visualization of the production process, making it easier for all involved to understand.
Efficiency: Identifying and rectifying bottlenecks becomes straightforward when each step of the process is mapped out.
Collaboration: Team members can collaborate in real time, offering suggestions and improvements.
Optimization: With a comprehensive overview, teams can streamline operations, reducing costs and improving output.
Documentation: The template acts as a reference point, ensuring everyone follows the established procedures. The template is easy to update as the production process changes, ensuring the most up-to-date version is always shared.
If you'd prefer to start from scratch, Miro's easy flowchart tool will help you build an online flowchart in no time. With Miro's collaboration features, you can workshop it with your team and easily share it with others for feedback with tagging, comments and sticky notes.
Can I customize the shapes and colors of the template?
Absolutely! The template is designed for full customization, allowing you to adjust shapes, colors, and text to represent your process best.
Is it suitable for all types of production processes?
Yes, the template is versatile and can be used for different types of productions. Whether you're mapping a simple or complex process, the template can be adapted to fit your needs.
How can I collaborate with team members using this template?
Miro allows for real-time collaboration. Team members can simultaneously view, edit, and comment, making collective input seamless.
Are there any limitations to how much I can expand the template?
With Miro’s infinite canvas, you can expand the template as much as you need — and if things get too expansive, simply zoom out or rearrange for clarity.
Get started with this template right now.
Logic Model Template
Works best for:
Diagramming
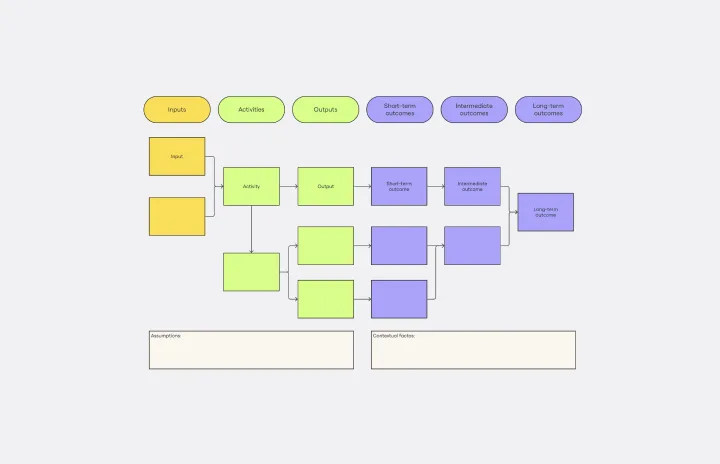
The logic model template is a strategic visual tool designed to delineate the relationship between a program's inputs, activities, outputs, and outcomes. By providing a clear and comprehensive map of the project lifecycle, stakeholders can swiftly grasp the intricate connections within a given initiative. One standout benefit of this template is its ability to enhance clarity: by visually representing the transformation of resources into anticipated results, teams can ensure more efficient and targeted use of their resources, thus maximizing the potential for success in their endeavors.

Force Field Analysis Template
Works best for:
Diagramming, Strategic Planning
A Force Field Analysis Template is a powerful tool that helps teams identify and analyze the forces supporting or hindering progress toward a specific change or goal. This template provides a visual space where you can brainstorm and plot out 'driving forces' that push objectives forward and 'restraining forces' that prevent advancement, all on a single, intuitive board. One of the primary benefits of utilizing the Force Field Analysis template is that it fosters a shared understanding among team members. By visually mapping out and discussing each force, teams can prioritize efforts, build consensus on the central issues to tackle, and collaboratively devise strategic plans to strengthen positive influences while reducing negative ones.

Stage-Gate Process Flowchart Template
Works best for:
Diagramming, Project Management
The Stage-Gate Process Flowchart Template structures a project into distinct stages separated by decision-making gates, enhancing the quality of decisions and leading to more successful project outcomes.
DMAIC Analysis Template
Works best for:
Agile Methodology, Design Thinking, Operations
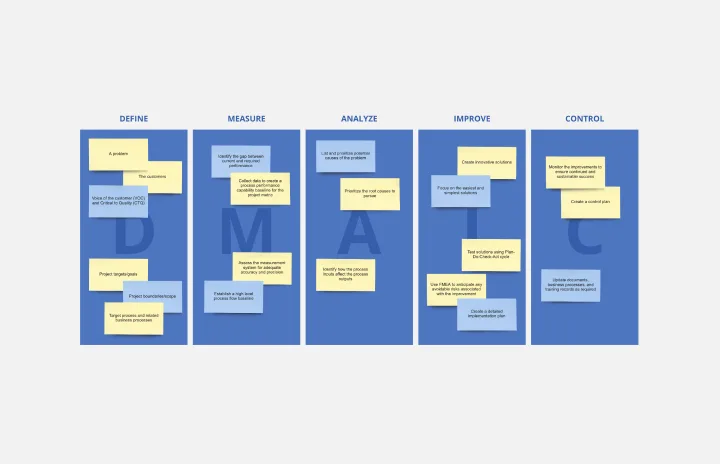
Processes might not seem like the funnest thing to dive into and examine, but wow can it pay off—a more efficient process can lead to serious cost savings and a better product. That’s what DMAIC analysis does. Developed as part of the Six Sigma initiative, DMAIC is a data-driven quality strategy for streamlining processes and resolving issues. The technique is broken into five fundamental steps that are followed in order: Define, Measure, Analyze, Improve, and Control.
SAFe Program Template
Works best for:
Agile Methodology, Diagrams, Agile Workflows
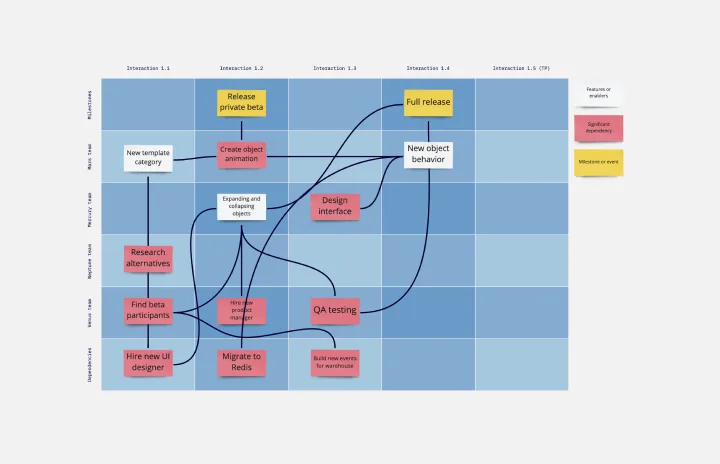
Many organizations use the Agile model, but even companies that don’t rigorously adhere to all Agile standards have adopted Agile tools and methods like Program Increment (PI) Planning. Even if you’re not participating in a formal PI session, a program board can be a great way to establish communication across teams and stakeholders, align development objectives with business goals, clarify dependencies, and foster cross-functional collaboration. The board provides much-needed structure to planning sessions, yet is adaptable enough to accommodate brainstorming and alignment meetings.
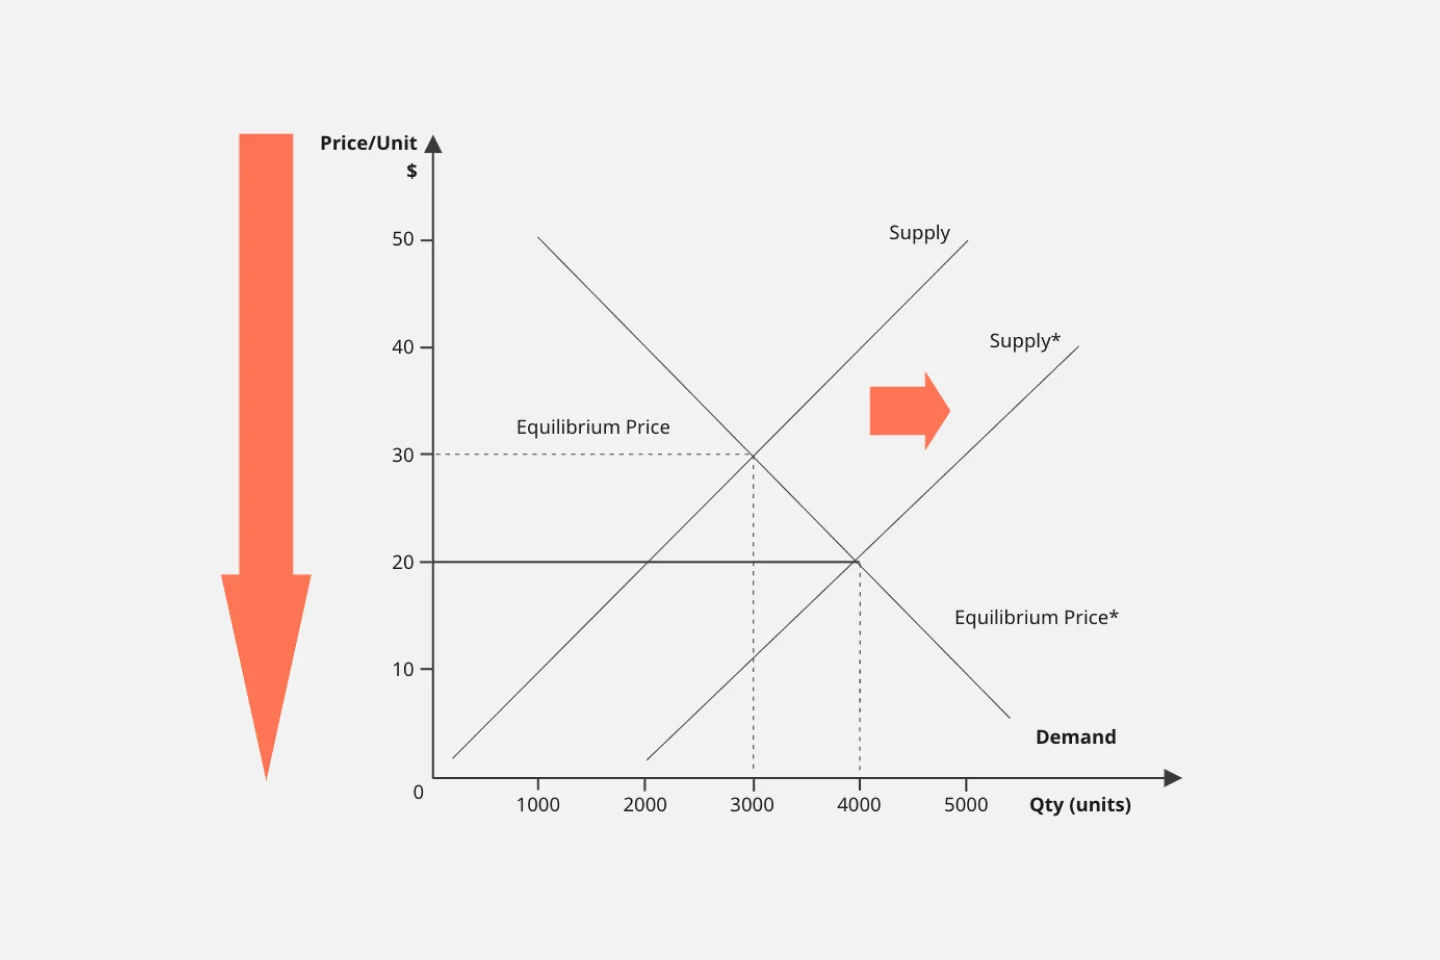
Supply and Demand Graph Template
Works best for:
Market Research, Mapping, Diagrams
How do you price your product so that you make a profit while keeping customers and manufacturers happy? By finding a fair price. A supply and demand diagram is a graph that visualizes how much demand there is for your product and how many products you need. This, in turn, helps you with product pricing.