Kano Model Template
Kano Analysis is a powerful tool where you can map which product attributes which are perceived to be important to customers. Ideal for product development and customer satisfaction.
Trusted by 65M+ users and leading companies


About the Kano model template
What is the Kano model?
The Kano model is a method for prioritizing features on a product roadmap. Prioritization is assigned based on the likelihood that a given feature will satisfy your customers. Product teams can use the Kano model to weigh a high-satisfaction feature against the costs of implementation, making it easier to decide whether they should add this feature to the roadmap. Many product managers prioritize features by grouping them into categories based on whether they are likely to disappoint, satisfy, or delight customers.
How does the Kano model work?
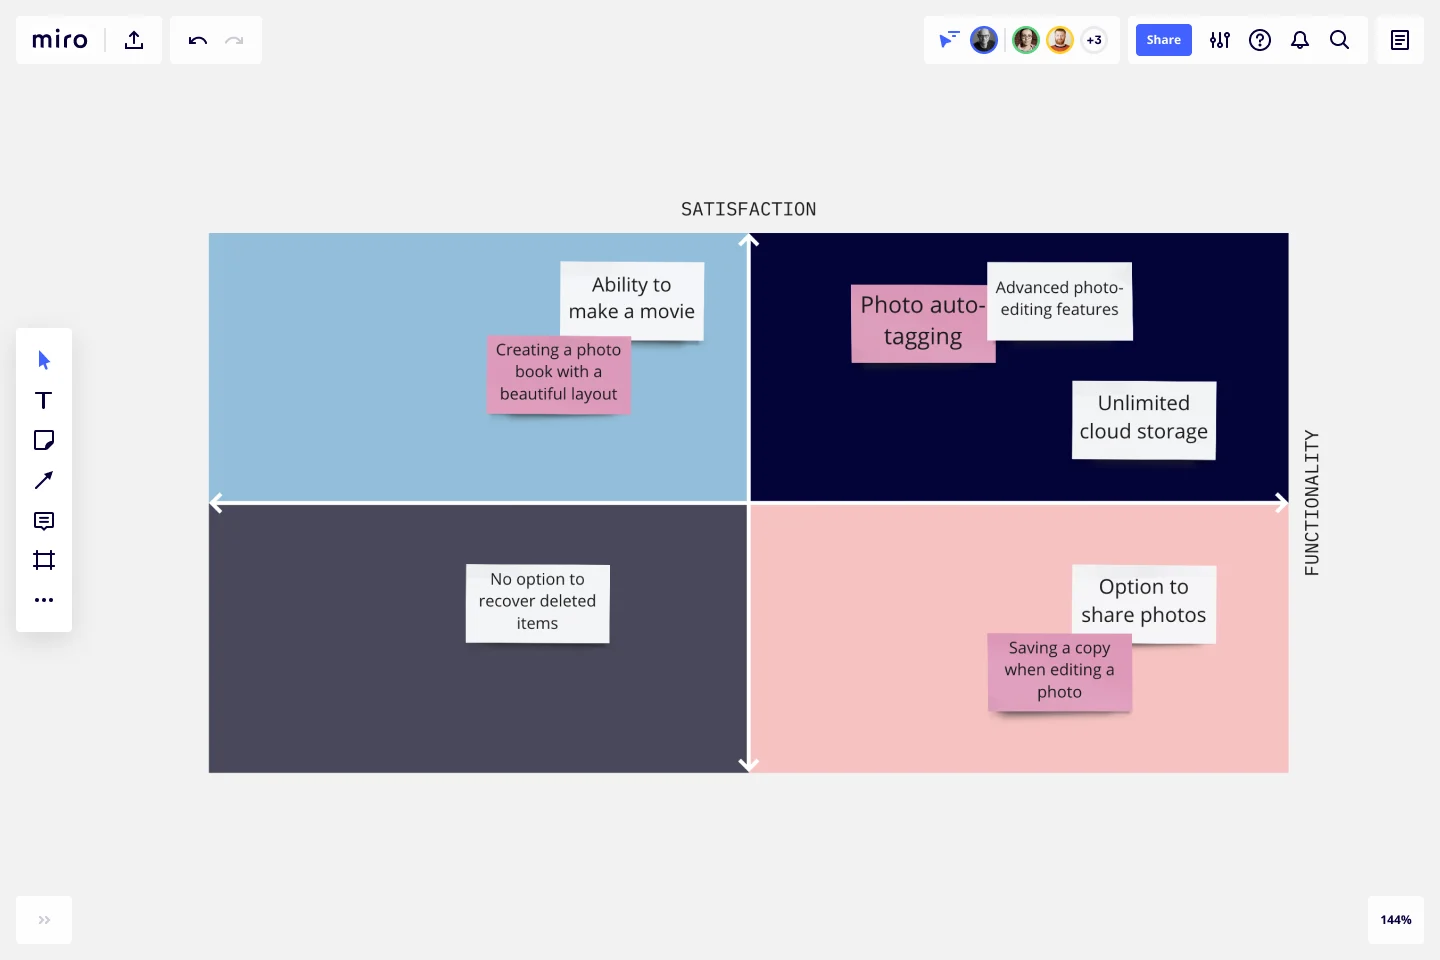
The Kano model uses two axes: satisfaction and functionality. The axes create a quadrant with four values: attractive, performance, indifferent, and must-be. Teams can use this model to understand, prioritize, and integrate the main categories of customer requirements into the products they develop. When teams understand which requirements are most valuable to customers, they can plan and use resources wisely.
What are the four categories in the Kano model?
The Kano model classifies features into four categories based on how customers might react to them.
Performance: These features directly impact whether the product is good at performing its intended function. Put another way: the more of this feature you receive, the greater your satisfaction will be. Gas mileage is the most common example. When you’re buying a car, you treat gas mileage as a Performance attribute.
Must-be: Customers expect these features. If your product doesn’t have one, then your customers will consider your project bad or incomplete. For example, you expect your car to have brakes. If it doesn’t have brakes, you’re not buying it.
Attractive: Although these features aren’t strictly necessary, they cause a positive reaction. A leather interior doesn’t make a car work any better, but it’s nice to have and increases the value of the car.
Indifferent: The presence or absence of this feature does not impact you in any way. Organizations typically avoid working on features that fall into this category because they are a waste of resources.
Create your own
Now that you know how to create your own Kano model, get started with this free template. It’s easy to create and share it with your teammates.
Get started with this template right now.
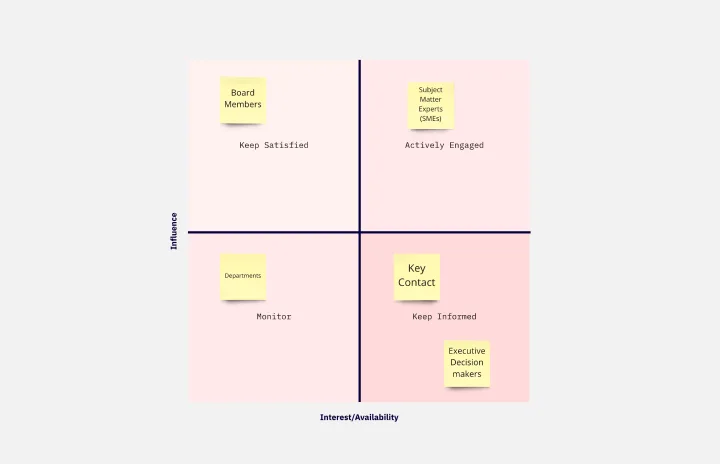
Stakeholder Analysis Template
Works best for:
Project Management, Strategic Planning, Project Planning
Managing stakeholders is integral to completing a project on time and meeting expectations, so here’s how to use a stakeholder analysis to help. A stakeholder analysis empowers you to meet expectations and complete projects on time by identifying individuals, groups, and organizations with a vested interest in a program or process. In a typical stakeholder analysis, you’ll prioritize stakeholders based on their influence on a project and seek to understand how best to interface with them throughout the course of the project.
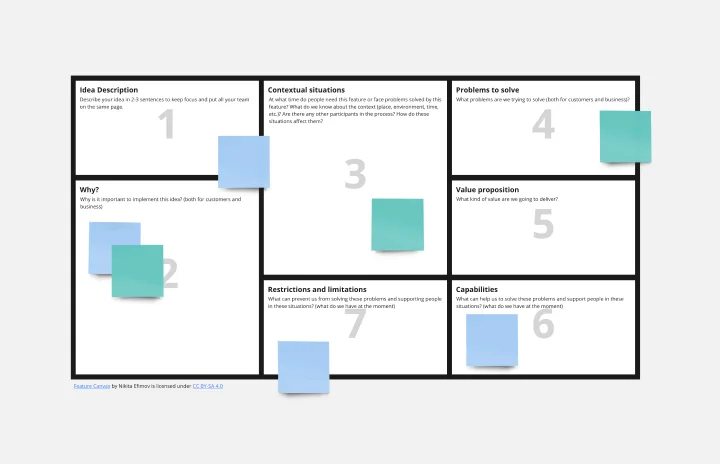
Feature Canvas Template
Works best for:
Design, Desk Research, Product Management
When you’re working on a new feature that solves a problem for your users, it’s easy to dive right in and start looking for solutions. However, it’s important to understand the initial user problem first. Use the Feature Canvas template to do a deep-dive into the user’s problems, the context in which they will use your feature, and the value proposition you will deliver to your users. The template enables you to spend more time exploring the problem to anticipate any potential blind spots before jumping into solutions mode.
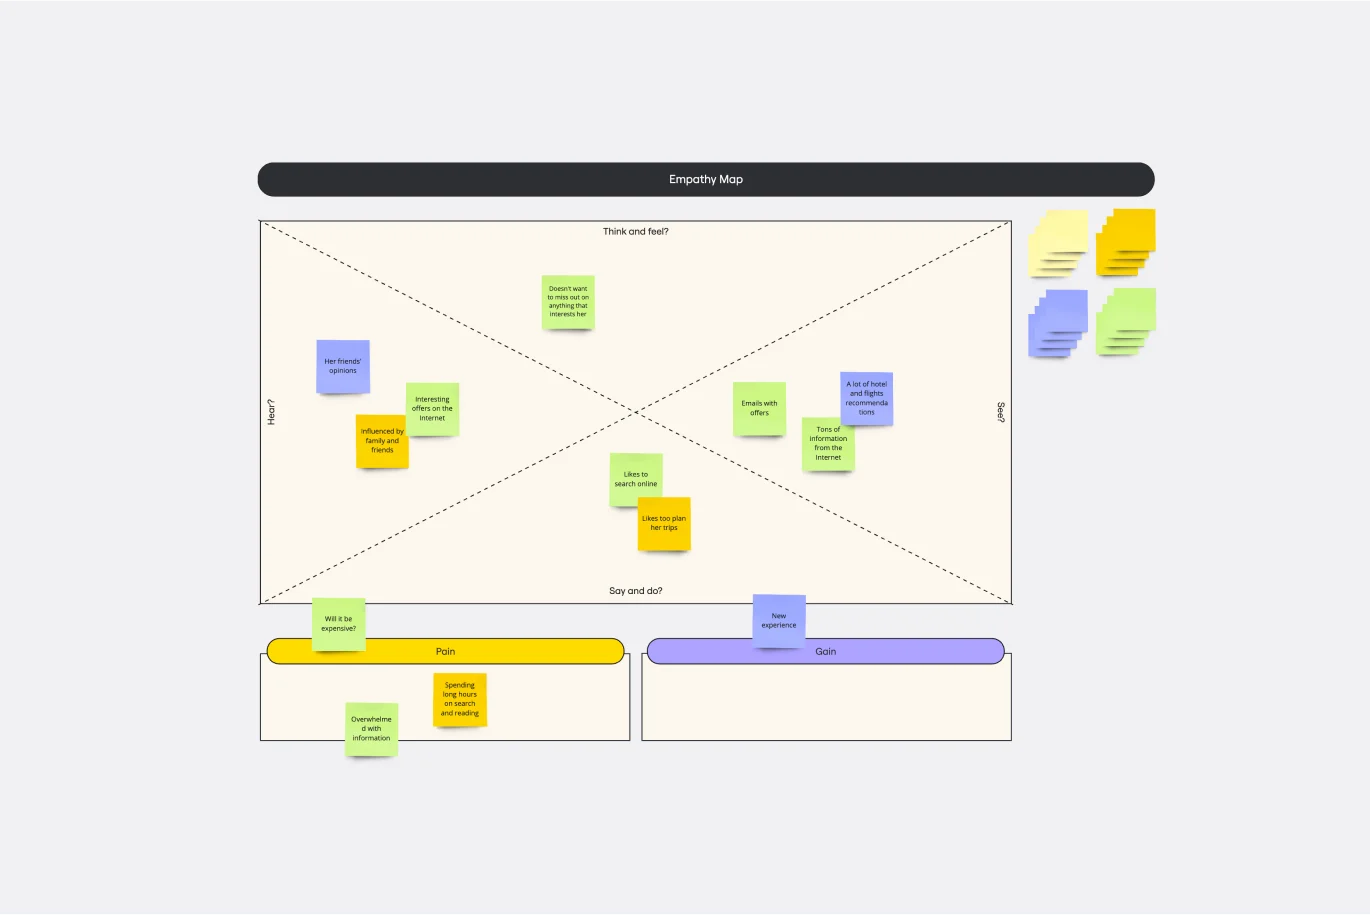
Empathy Map Template
Works best for:
Market Research, User Experience, Mapping
Attracting new users, compelling them to try your product, and turning them into loyal customers—it all starts with understanding them. An empathy map is a tool that leads to that understanding, by giving you space to articulate everything you know about your customers, including their needs, expectations, and decision-making drivers. That way you’ll be able to challenge your assumptions and identify the gaps in your knowledge. Our template lets you easily create an empathy map divided into four key squares—what your customers Say, Think, Do, and Feel.
Google Cloud Architecture Diagram Template
Works best for:
Software Development, Diagrams
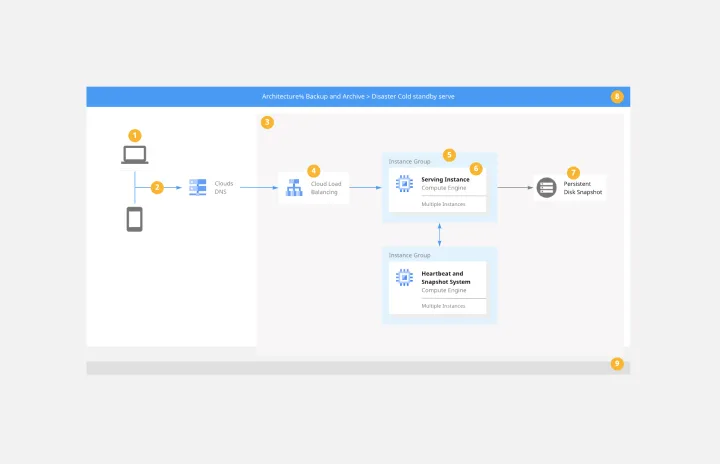
Use the Google Cloud Architecture Diagram template to clearly visualize the deployment of your application and allow you and your team to optimize processes. The GCP template gives you a great overview of your application architecture, and it helps you to iterate quickly and better manage your application development, deployment, and documentation. Try it out and see if it works for you.
Design Research Template
Works best for:
UX Design, Design Thinking, Desk Research
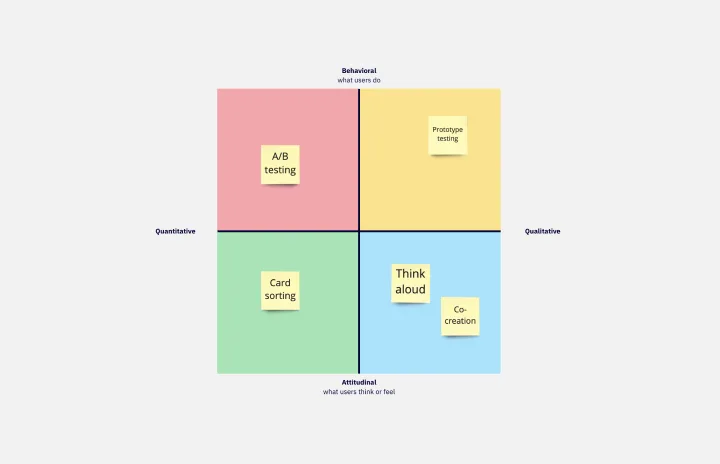
A design research map is a grid framework showing the relationship between two key intersections in research methodologies: mindset and approach. Design research maps encourage your team or clients to develop new business strategies using generative design thinking. Originally designed by academic Liz Sanders, the framework is meant to resolve confusion or overlap between research and design methods. Whether your team is in problem-solving or problem space definition mode, using a research design template can help you consider the collective value of many unrelated practices.
Product / Market Fit Canvas Template
Works best for:
Market Research, Strategic Planning, Product Management
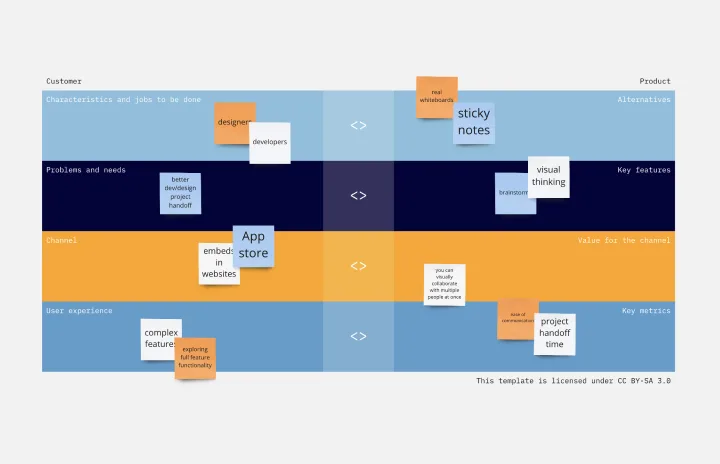
The product/market fit canvas template is used to help product teams meet customer and market needs with their product design. This template looks at a product in two dimensions: first, how the product fits user needs, and second, how the fully designed product fits within the market landscape. This combined metric understands a product holistically from the way customers use and desire a product, to the market demand. By comparing customer and product qualities side by side, users should better understand their product space and key metrics.