Cladogram Template
Easily explain evolutionary relationships with the Cladogram Template.
Trusted by 65M+ users and leading companies


About the Cladogram Template
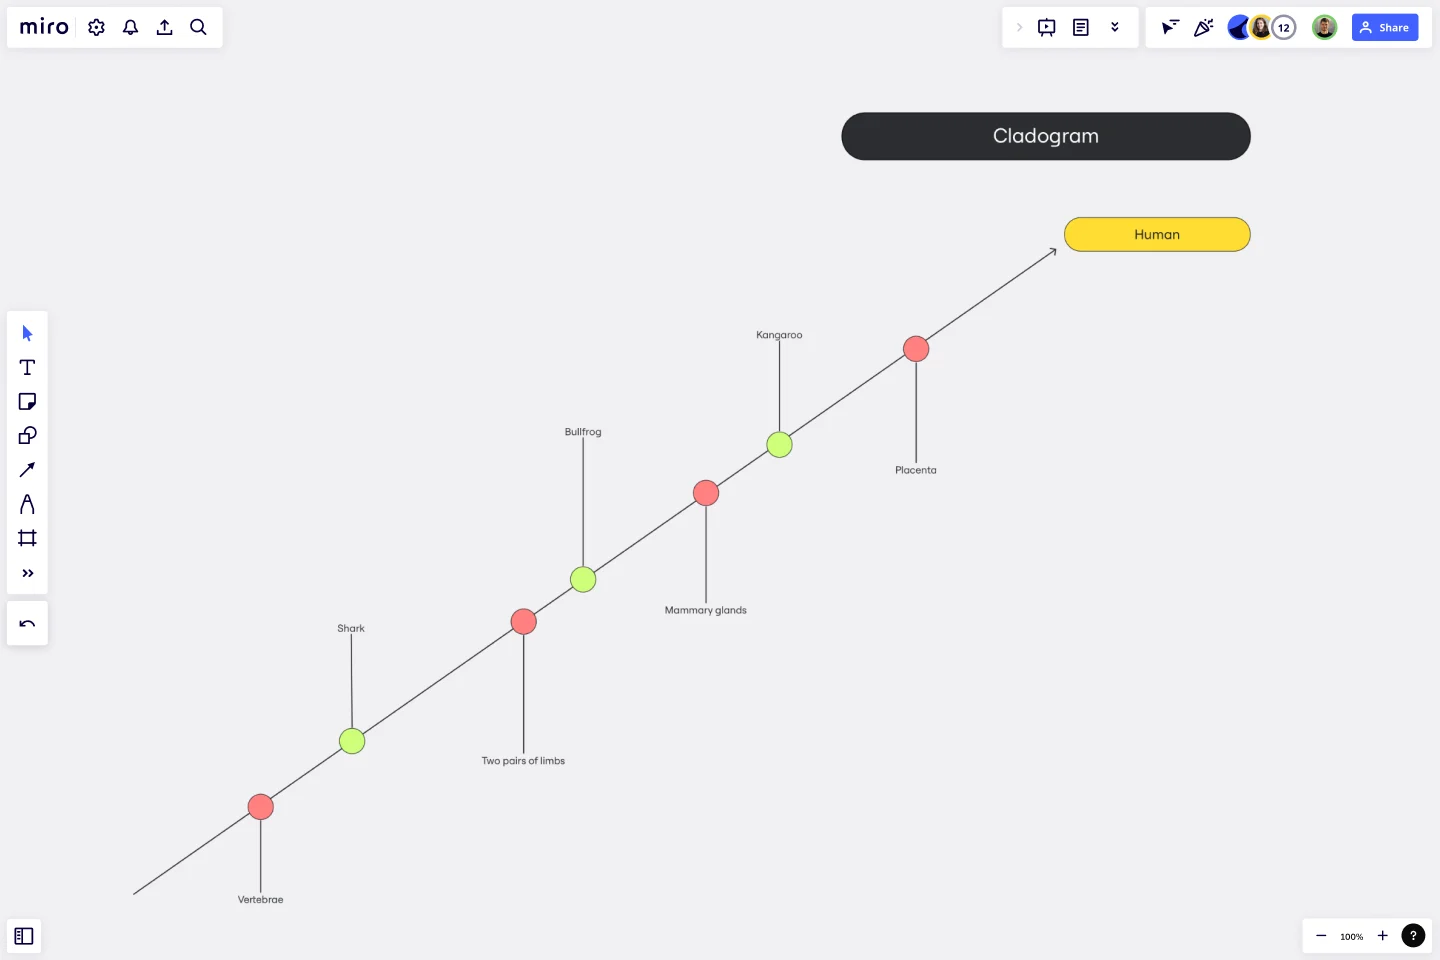
The Cladogram Template is a helpful visual tool that simplifies the representation of evolutionary relationships among different species or concepts. A cladogram is a branching diagram that displays the connections between various entities based on shared characteristics and evolutionary divergence.
The template enables users to easily create, edit, and expand cladograms. It's a powerful asset for educators, scientists, and professionals who want to simplify complex relationships and showcase evolutionary connections.
How to use the cladogram template in Miro
Customize easily: Edit the template with just a few clicks, tailoring it to your specific requirements. Change labels, change branches, and adjust the structure effortlessly.
Automated diagramming: Leverage Miro's automated diagramming features to expand your cladogram. The platform intelligently adjusts the layout as you add or remove elements, ensuring a visually appealing and logically structured diagram.
Add context: Enhance your cladogram by incorporating artifacts from your Miro board. This could include images, text, or other relevant materials, providing additional context and depth to your evolutionary representation.
Why use a cladogram template?
Simplify complex concepts: Simplify intricate evolutionary relationships and present them in a clear and comprehensible format.
Enhance collaboration: Facilitate team collaboration by visualizing a shared understanding of evolutionary connections.
Save time: Use the template's user-friendly design and automation features, which allow you to focus on content rather than formatting.
Dynamic adaptability: Adapt your cladogram quickly as new information arises or concepts evolve, ensuring that your diagrams remain relevant.
Effective communication: Communicate complex ideas effectively, whether in the classroom, research setting, or professional environment.
Find out all the features of Miro's cladogram maker and start building your diagram right now.
Can I customize the colors and shapes of elements in the cladogram?
Miro's cladogram template allows complete customization, including colors, shapes, and labels, empowering you to create visually appealing and informative diagrams.
Can I export the cladogram created in Miro to other file formats?
Yes, Miro supports various export formats, ensuring that your cladogram can be shared in multiple ways, such as PDFs or images.
Get started with this template right now.
Challenge - UML Iphone
Works best for:
Diagramming
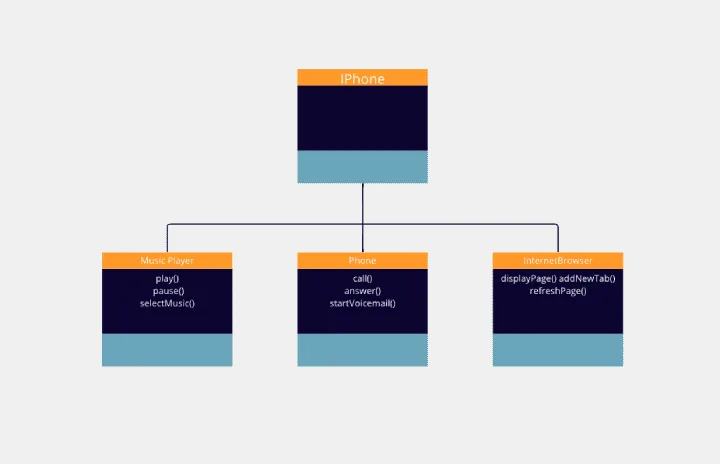
The Challenge UML Iphone template offers a visual framework for designing and modeling iPhone app challenges and solutions using UML (Unified Modeling Language). It provides elements for defining app functionalities, user interactions, and system architecture. This template enables teams to brainstorm ideas, document requirements, and visualize app designs, facilitating collaboration and innovation. By promoting clarity and alignment, the Challenge - UML Iphone template empowers teams to design iPhone apps that meet user needs and deliver exceptional user experiences.
UML Class Diagram Template
Works best for:
UML Class Diagram Template, Mapping, Diagrams
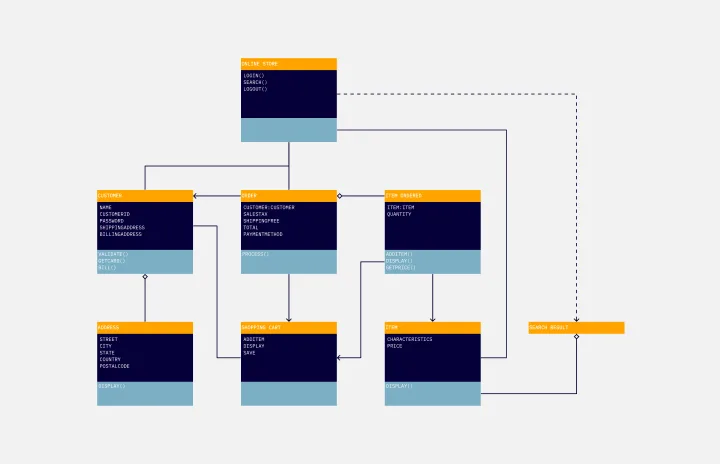
Get a template for quickly building UML class diagrams in a collaborative environment. Use the UML class diagram template to design and refine conceptual systems, then let the same diagram guide your engineers as they write the code.

Opportunity Solution Tree Template
Works best for:
Flowcharts, Product Management, Diagrams
Solving problems — successful companies and productive teams just know how to do it. They’re able to identify many possible solutions, then settle on the one that leads to the desired outcome. That’s the power an Opportunity Solution Tree gives you. Designed by Teresa Torres, a product discovery coach, this mind map breaks down your desired outcome into opportunities for the product to meet user needs, then gives your team an effective way to brainstorm potential solutions.
Job Search Process Diagram
Works best for:
Diagramming
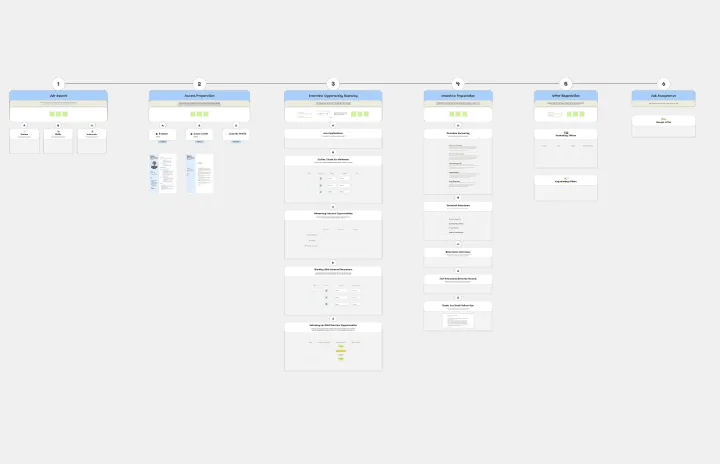
The Job Search Process Diagram template offers a visual tool for mapping out the steps and stages involved in the job search process. It provides a structured framework for organizing tasks, tracking progress, and managing resources. This template enables job seekers to streamline their job search efforts, stay organized, and increase their chances of success. By promoting clarity and efficiency, the Job Search Process Diagram empowers individuals to navigate the job market effectively and achieve their career goals.
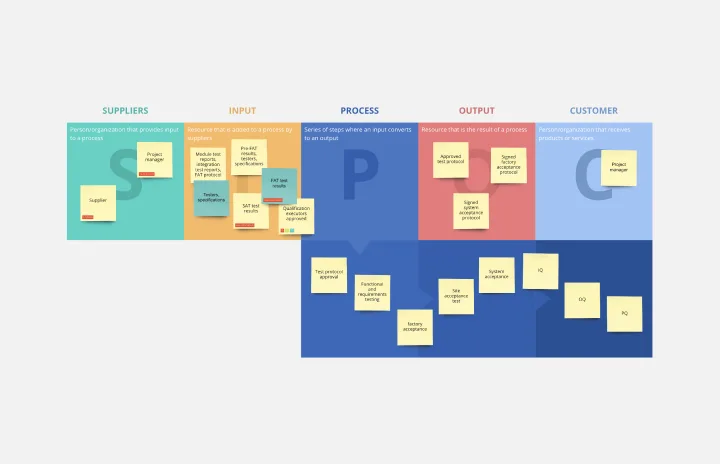
SIPOC Template
Works best for:
Agile Methodology, Strategic Planning, Mapping
A SIPOC diagram maps a process at a high level by identifying the potential gaps between suppliers and input specifications and between customers and output specifications. SIPOC identifies feedback and feed-forward loops between customers, suppliers, and the processes and jump-starts the team to think in terms of cause and effect.
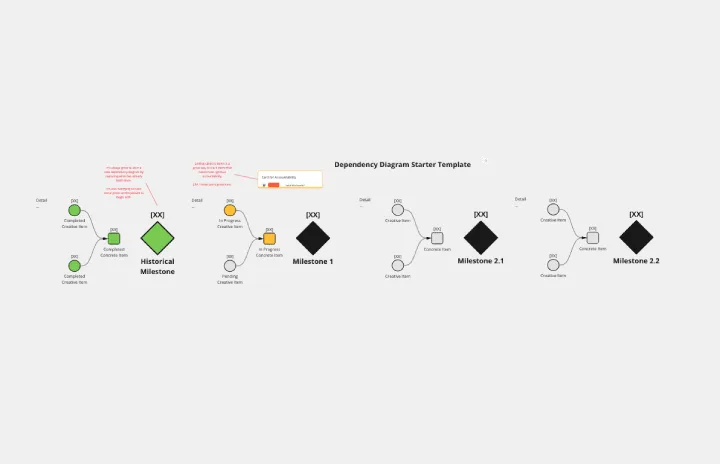
Dependency Diagrams Educational Board
Works best for:
Diagramming
The Dependency Diagrams Educational Board template provides a visual tool for teaching and learning about dependency relationships between components in systems. It offers a structured framework for illustrating dependencies, connections, and interactions within a system or process. This template enables educators to explain complex concepts effectively and engage learners in interactive activities. By promoting visual learning and understanding of dependencies, Dependency Diagrams empower students to grasp fundamental principles of systems thinking and analysis.