Cisco Network Diagram Template
Cisco offers data center and access networking solutions built for scale with industry-leading automation, programmability, and real-time visibility.
Trusted by 65M+ users and leading companies


About the Cisco Data Network Diagram Template
Cisco offers data center and access networking solutions built for scale with industry-leading automation, programmability, and real-time visibility. The Cisco Data Network Diagram template can help you design and showcase the organization’s network infrastructure.
Keep reading to learn more about the Cisco Data Network Diagram Template.
What is the Cisco Data Network Diagram Template
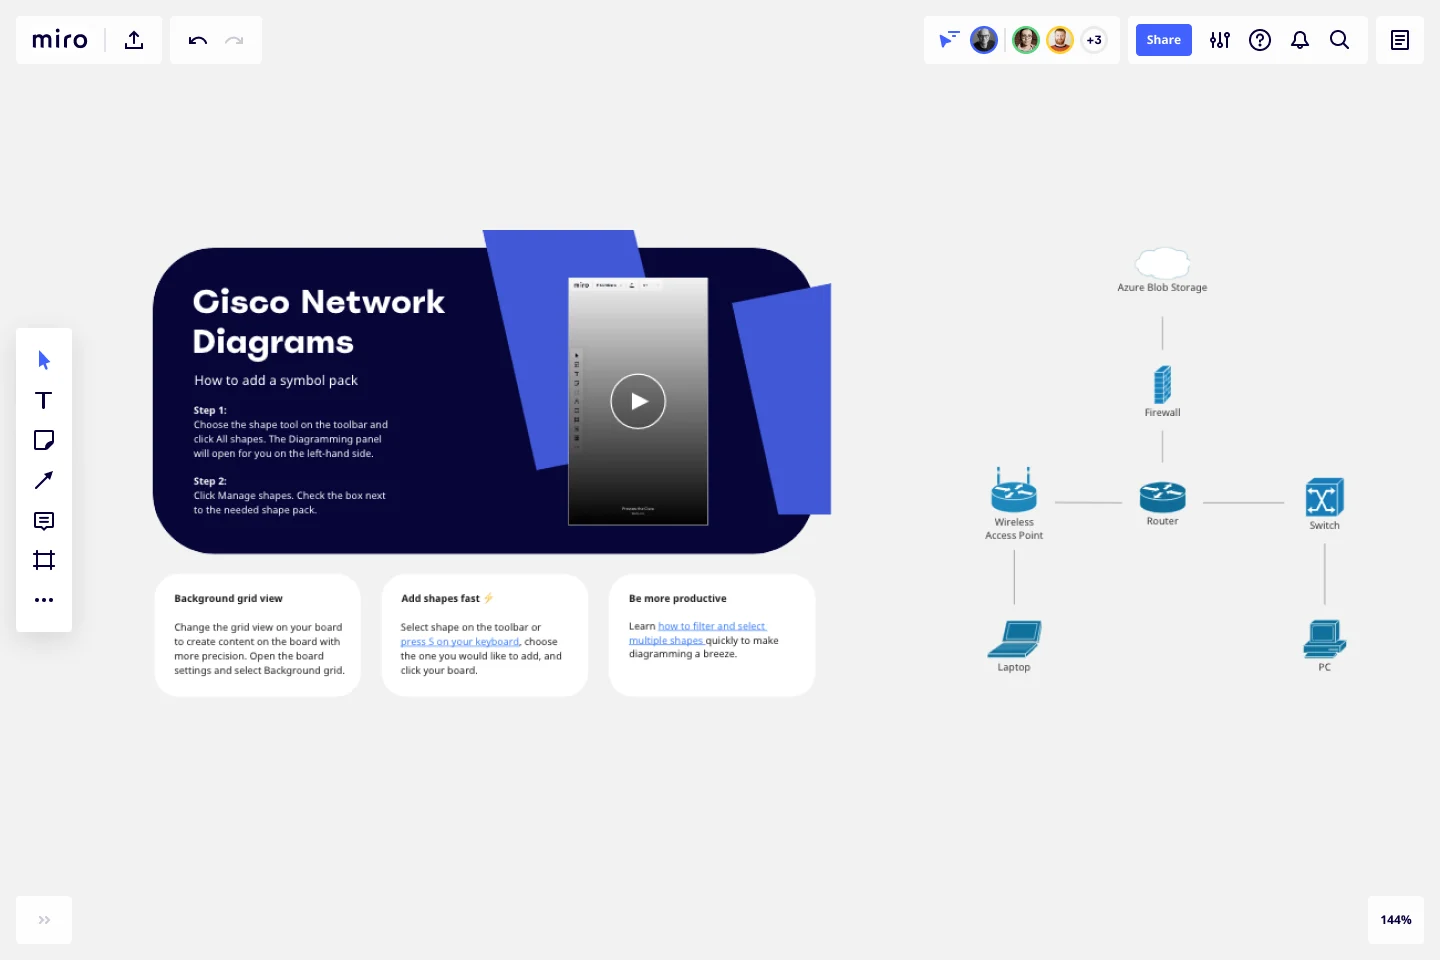
The Cisco Data Network Diagram Template, like any other network diagram, visually shows the design of the network infrastructure. The Cisco Data Network Diagram has unique icons and symbols.
When to use Cisco Data Network Diagram Template
You can use the Cisco Data Network Diagram Template to visualize the telecommunication and computer network topology and layout.
Here you can find the semantics of Cisco Data Network Diagrams:
Shapes: Icons represent a Cisco service or product.
Connectors: Use arrows to indicate flows (e.g. data, information, communication). Use a single-headed arrow to indicate a single initiator. Use a double-headed arrow to indicate that the icon shown at either end of the arrow can initiate a flow.
Layout and Grouping: Groups show the connection between multiple services/products and can represent layers of the architecture.
If you are interested in creating other network diagrams, Miro is the perfect network diagram tool with several available shape packs and templates to suit your needs.
How do I make a Cisco Data Network Diagram Template?
To make a Cisco Data Network Diagram in Miro is easy. You can use our Cisco Data Network Diagram Template and customize it as you see fit. Once you have the diagram structure, you can start adding the icons. You can find the icons under our Cisco Icon Set integration.
Get started with this template right now.
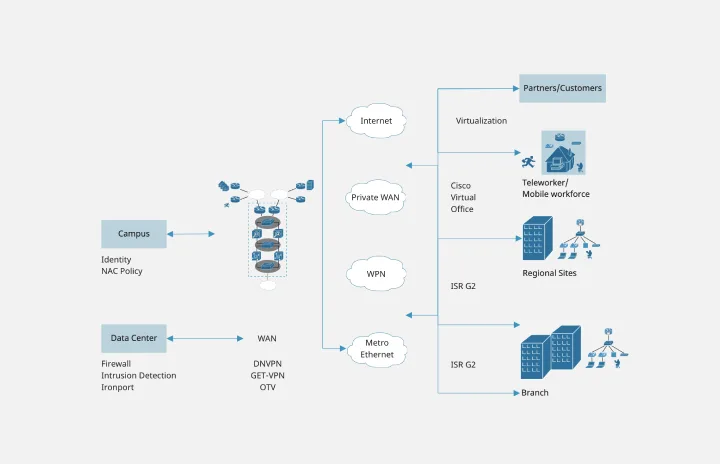
Cisco Recommended Security Architecture Template
Works best for:
Software Development, Diagrams
Cisco offers data center and access networking solutions built for scale with industry-leading automation, programmability, and real-time visibility. The Cisco Recommended Security Architecture uses Cisco elements to visually show the network design of Cisco networks.
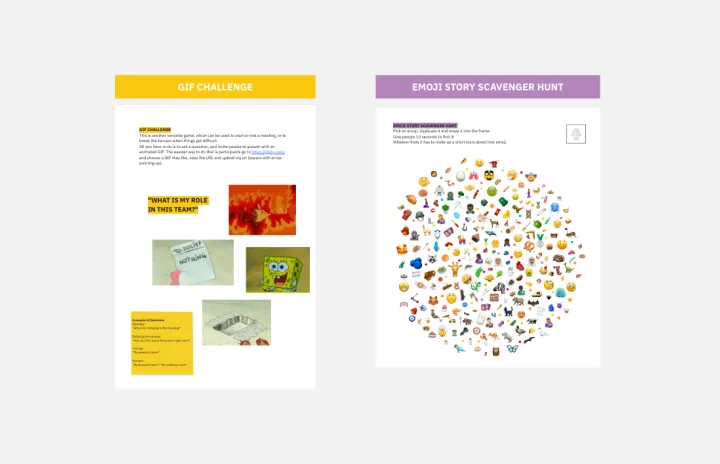
Workshop and Meetings Energizers Template
Works best for:
Icebreakers, Meetings
Begin every online session by engaging people right away with workshops and meeting energizers.

Force Field Analysis Template
Works best for:
Diagramming, Strategic Planning
A Force Field Analysis Template is a powerful tool that helps teams identify and analyze the forces supporting or hindering progress toward a specific change or goal. This template provides a visual space where you can brainstorm and plot out 'driving forces' that push objectives forward and 'restraining forces' that prevent advancement, all on a single, intuitive board. One of the primary benefits of utilizing the Force Field Analysis template is that it fosters a shared understanding among team members. By visually mapping out and discussing each force, teams can prioritize efforts, build consensus on the central issues to tackle, and collaboratively devise strategic plans to strengthen positive influences while reducing negative ones.
Affinity Diagram by UserPeek
Works best for:
Diagramming
The Affinity Diagram template is a visual tool for organizing and categorizing ideas, data, or issues into related groups. It provides a structured framework for conducting group brainstorming and affinity grouping activities. This template enables teams to synthesize information, identify patterns, and generate insights collaboratively. By promoting creativity and collaboration, the Affinity Diagram empowers teams to organize and prioritize information effectively, driving decision-making and problem-solving processes efficiently.
DMAIC Analysis Template
Works best for:
Agile Methodology, Design Thinking, Operations
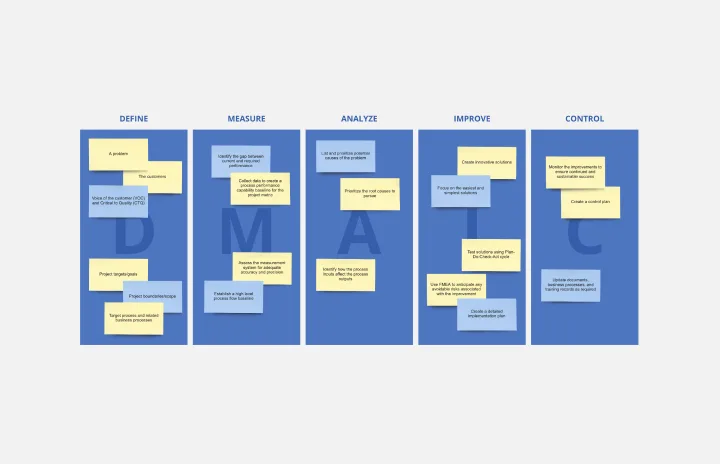
Processes might not seem like the funnest thing to dive into and examine, but wow can it pay off—a more efficient process can lead to serious cost savings and a better product. That’s what DMAIC analysis does. Developed as part of the Six Sigma initiative, DMAIC is a data-driven quality strategy for streamlining processes and resolving issues. The technique is broken into five fundamental steps that are followed in order: Define, Measure, Analyze, Improve, and Control.

Azure Demand Forecasting Template
Works best for:
Software Development, Diagrams
The Azure Demand Forecasting diagram will show the architecture of a demand forecast, making it easier for you to predict data consumption, costs, and forecast results. Azure is Microsoft’s cloud computing platform, designed to provide cloud-based services such as remote storage, database hosting, and centralized account management. Azure also offers new capabilities like AI and the Internet of Things (IoT).