Algorithm Flowchart Template
Simplify the process of creating complex algorithms with the algorithm flowchart template.
Trusted by 65M+ users and leading companies


About the Algorithm Flowchart Template
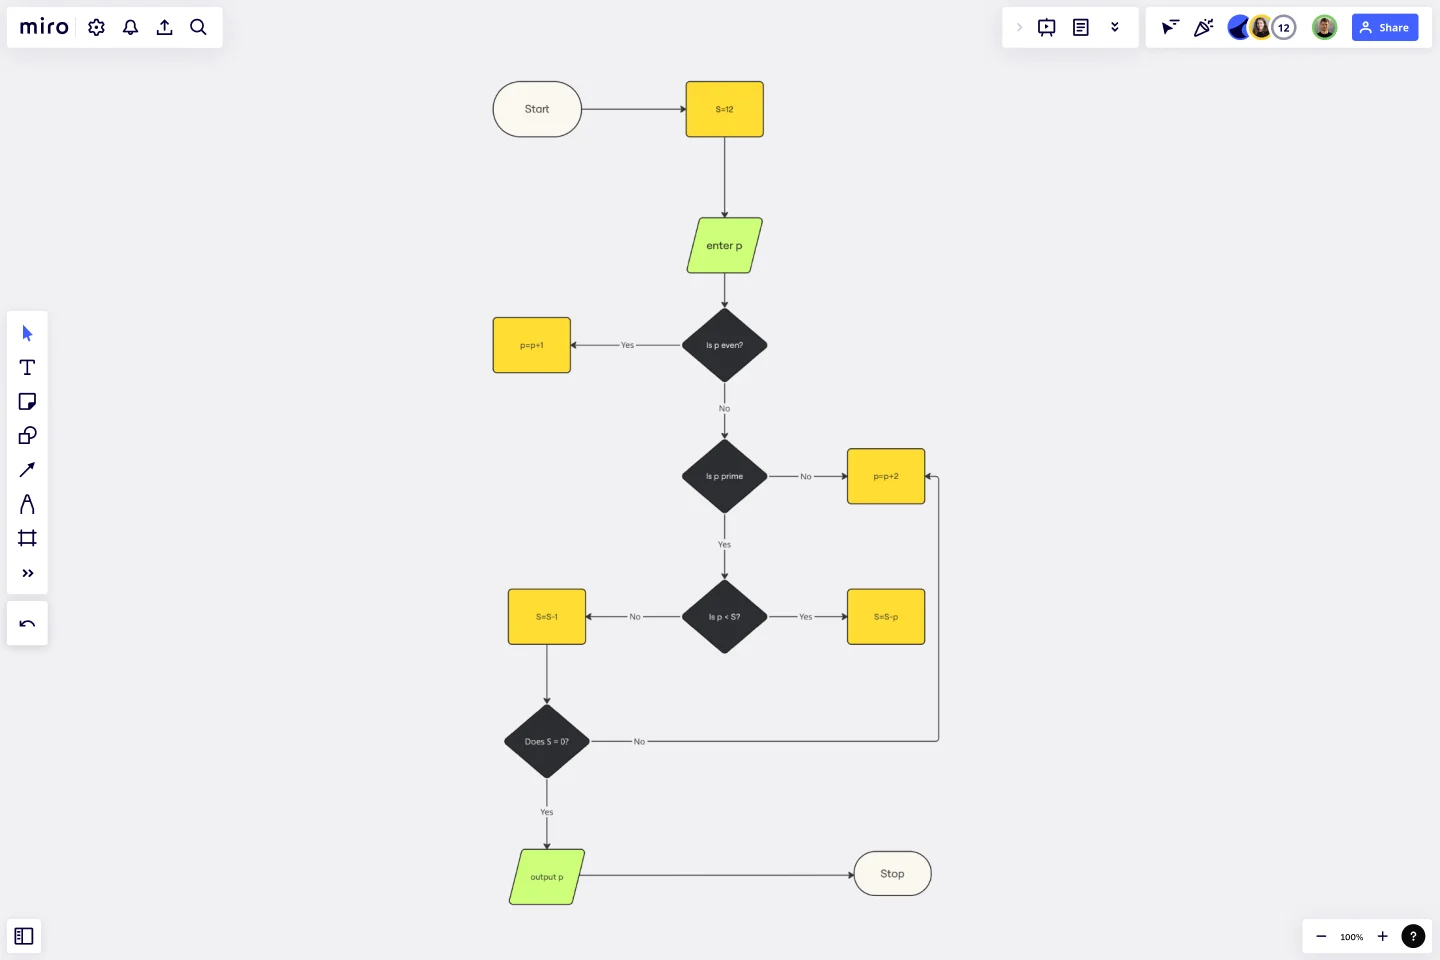
An algorithm flowchart is a graphical representation of a sequence of actions that make up an algorithm. It helps to streamline complex processes and make them easy to understand. Think of it as a blueprint that guides you through the logic of your algorithm, making it easier to go from problem to solution.
The algorithm flowchart template is a pre-designed framework that makes it easy to map out the process flow of an algorithm. It simplifies each step by breaking it down into individual components, represented by different shapes such as rectangles, diamonds, and ovals. Each shape represents a type of action or decision. By using clearly defined areas for input, operations, decisions, and outputs, users can methodically plot the course of their algorithm's logic. This tool is helpful for both beginners and experienced professionals.
How to use the algorithm flowchart template in Miro
Customize the flowchart: Double-click shapes to add your specific algorithm steps. The template is user-friendly, enabling you to edit text and shapes with just a few clicks.
Expand the diagram: Use automated diagramming features to drag and drop more shapes and connector lines, seamlessly expanding your flowchart.
Add context: Integrate any artifact on your board, such as notes, images, or links, to provide deeper insight into your algorithm.
The entire process is designed for efficiency and adaptability, ensuring your algorithm flowchart can grow and evolve as your project does.
Why use an algorithm flowchart template?
Clarity of complex processes: It transforms intricate algorithms into clear, visual steps, enhancing understanding for all stakeholders.
Efficiency in design: Saves time by providing a ready-made structure, which can be easily adjusted to fit various algorithms.
Collaboration: Fosters teamwork by allowing multiple contributors to view and edit the flowchart in real-time.
Reduce error: By laying out each step visually in a flowchart, potential issues can be identified and corrected early in the development process.
Documentation: The template acts as a dynamic document that can be referenced throughout the algorithm's lifecycle, from development to maintenance.
If you'd prefer to create an algorithm flowchart from scratch, Miro's flowchart tool is easy and intuitive to use.
Can the algorithm flowchart template handle complex algorithms with multiple conditions?
Absolutely. The template is designed to accommodate a variety of complexities, including algorithms with numerous conditions and branches.
Is it possible to export the flowchart for use in presentations or documents?
Yes, flowcharts created with the template can be exported and included in various document formats, making them suitable for presentations and reporting.
How does collaboration work with this template?
The template supports real-time collaboration. Multiple people can work on the flowchart simultaneously, making it perfect for team projects.
Are there any limits to how much I can customize the template?
There are no inherent limits. The template is fully customizable, allowing users to expand and change to meet their needs without restriction.
Get started with this template right now.
Cisco Recommended Security Architecture Template
Works best for:
Software Development, Diagrams
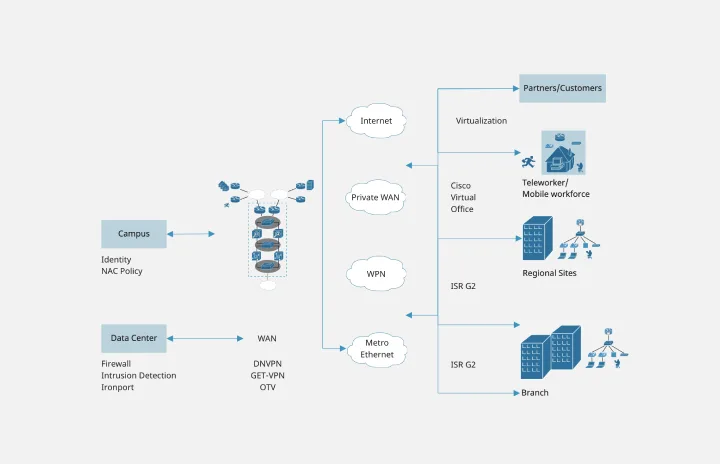
Cisco offers data center and access networking solutions built for scale with industry-leading automation, programmability, and real-time visibility. The Cisco Recommended Security Architecture uses Cisco elements to visually show the network design of Cisco networks.
CI/CD Pipeline Diagram Template
Works best for:
Diagramming, Development
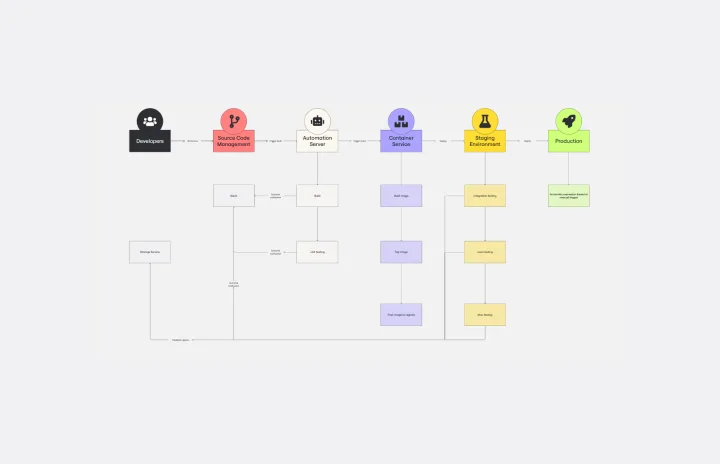
The CI/CD template is a well-designed roadmap for software deployment that enables a smooth and automated flow from development to production. This strategic layout includes critical elements such as source code management, automation servers, container orchestration, staging environments, and the final deployment to production. One of the key benefits of using such a template is that it builds a robust deployment pipeline, which significantly reduces manual intervention and human error. By visualizing each step and integrating automation throughout, teams can achieve faster deployment cycles, ensuring that new features, updates, and fixes are delivered to users promptly and reliably. This enhanced pace does not compromise quality, as the template inherently supports continuous testing and quality assurance, ensuring that each update is quick but also secure and stable before it is delivered to the end user.
Kubernetes Architecture Diagram Template
Works best for:
Software Development, Diagrams
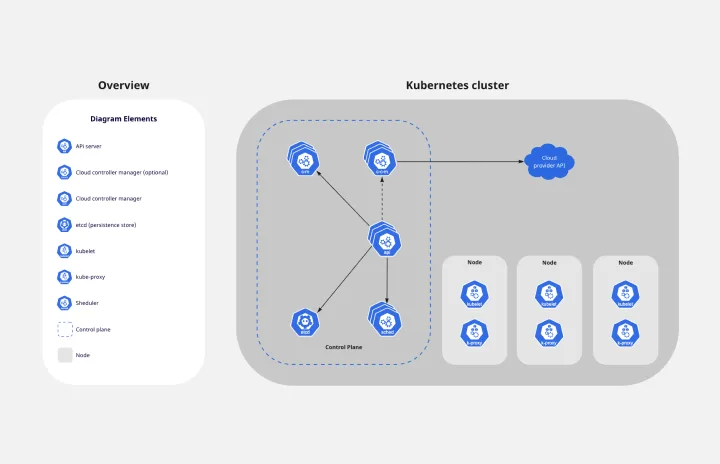
Use the Kubernetes Architecture Diagram template to manage your containerized applications better and bring your apps’ deployment, management, and scalability to the next level. This template helps you lower the downtime in production and allows you to have a more agile app production. Improve the deployment of your apps by visualizing every step of the process with the Kubernetes Architecture template. Try it out, and see if it works for you and your team.
UML Component Diagram Template
Works best for:
Mapping, Diagrams, Software Development
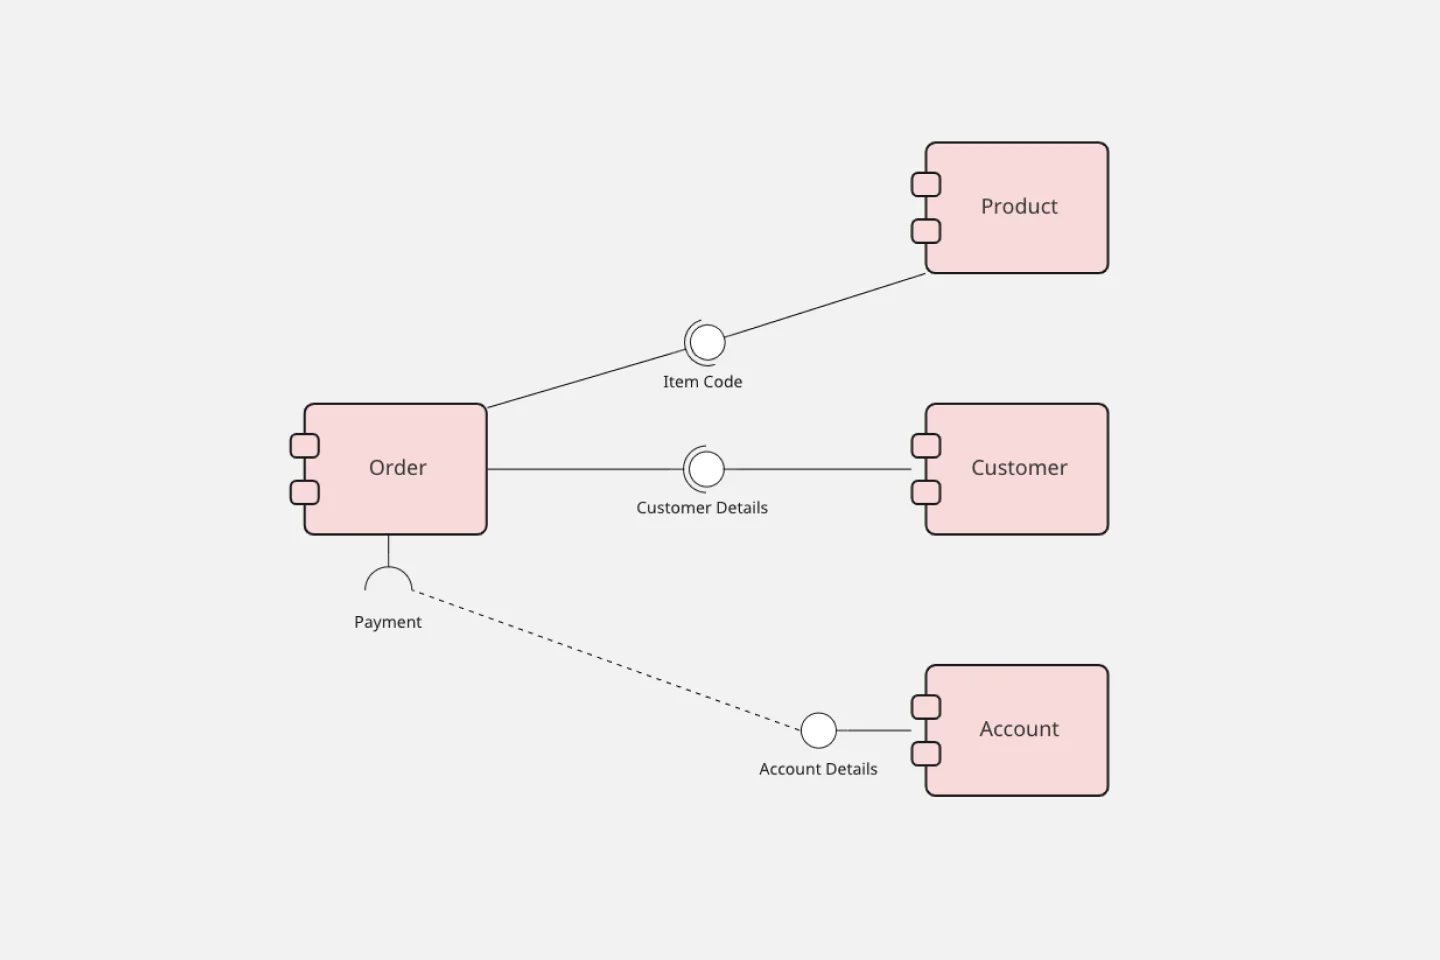
Use our Component Diagram template to show how a system’s physical components are organized and wired together. Visualize implementation details, make sure planned development matches system needs, and more — all in a collaborative environment.

Stage-Gate Process Flowchart Template
Works best for:
Diagramming, Project Management
The Stage-Gate Process Flowchart Template structures a project into distinct stages separated by decision-making gates, enhancing the quality of decisions and leading to more successful project outcomes.

Force Field Analysis Template
Works best for:
Diagramming, Strategic Planning
A Force Field Analysis Template is a powerful tool that helps teams identify and analyze the forces supporting or hindering progress toward a specific change or goal. This template provides a visual space where you can brainstorm and plot out 'driving forces' that push objectives forward and 'restraining forces' that prevent advancement, all on a single, intuitive board. One of the primary benefits of utilizing the Force Field Analysis template is that it fosters a shared understanding among team members. By visually mapping out and discussing each force, teams can prioritize efforts, build consensus on the central issues to tackle, and collaboratively devise strategic plans to strengthen positive influences while reducing negative ones.