Gantt Chart Template
Keep track of all your tasks in this visual timeline and move your project forward with the Gantt Chart Template. Improve your efficiency and reach your goals.
Trusted by 65M+ users and leading companies


About the Gantt Chart Template
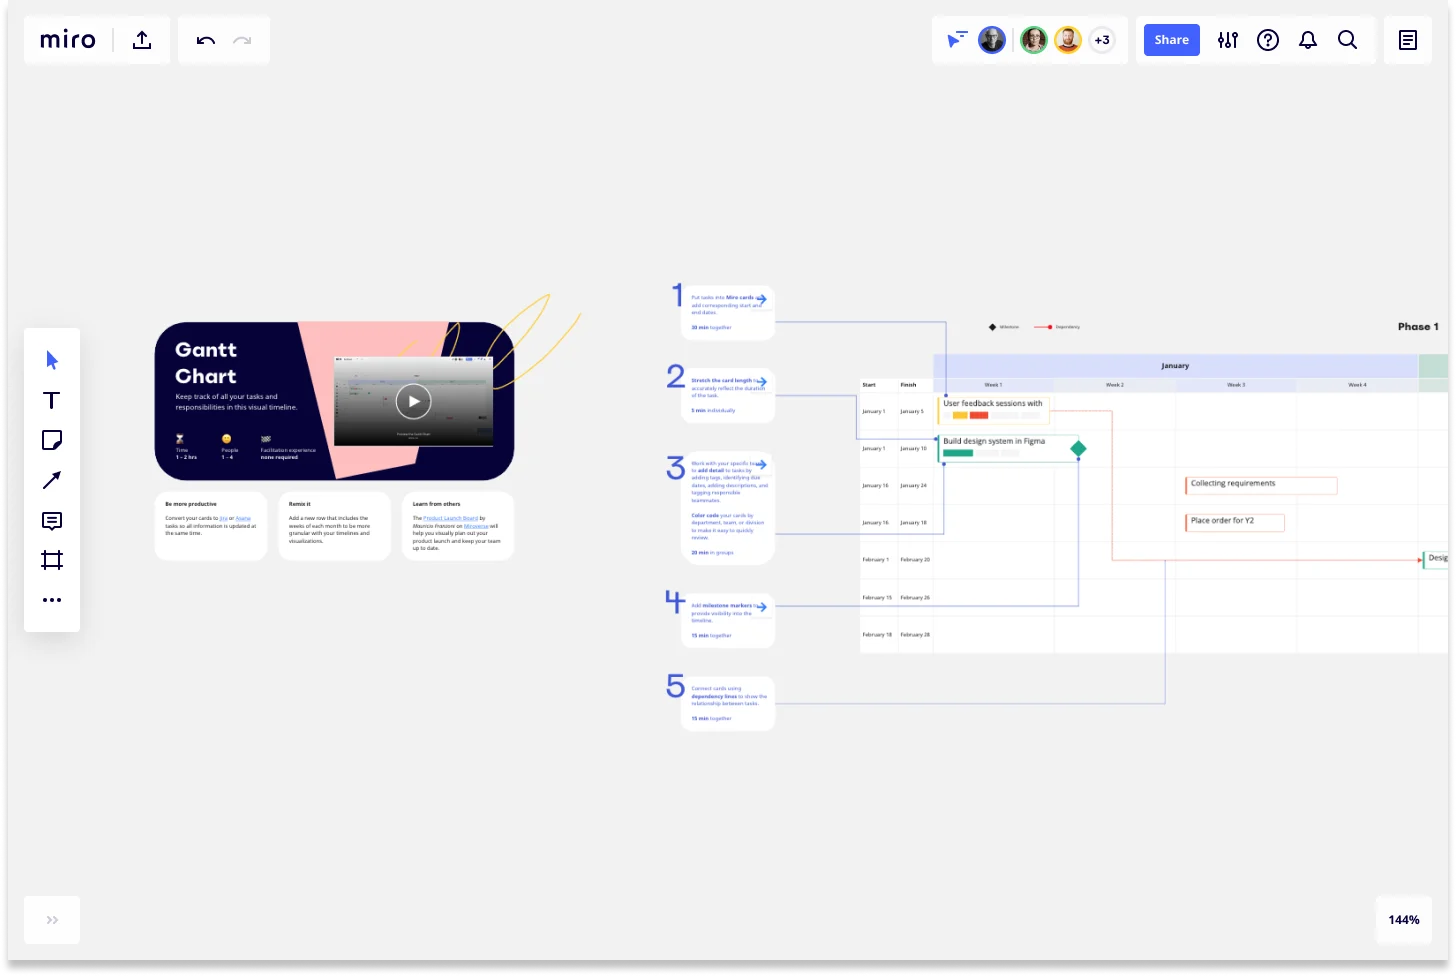
A Gantt chart is a powerful and widely used graphical timeline representation that shows the progression of a project plan over time. Most Gantt chart templates show the status of each step in the project and the stakeholders. They break down projects by task, enabling the team to see the task status, who it’s assigned to, and how long it will take to complete.
Gantt chart templates are also an excellent way to identify a project's dependencies and bottlenecks, making them an essential tool for collaboration and efficiency. Although Gantt charts vary by organization and team, they typically include a few key components:
The task list runs vertically down the left-hand side of the chart. It describes project work and is often organized into groups and subgroups.
The timeline runs horizontally across the top of the chart and portrays the project's progression.
The horizontal bars on the right-hand side of the chart represent progress toward a given goal. Gantt charts also show milestones, dependencies, and stakeholders.
Gantt charts allow you to capture the essential details of a project in a given timeframe. At a glance, you can see what tasks need to be done, who is responsible for them, the status of tasks, as well as the planned start and end dates of the project and its subtasks.
How to use the Gantt chart template
Miro is the perfect tool to create and manage a Gantt chart with your team. Start by selecting the Gantt chart template and follow the steps below:
Step 1: Establish a timeframe
A well-constructed Gantt chart must have a well-defined beginning and end. In a way, a Gantt chart is like a combination of a timeline and a Kanban board. It is essential to establish a time frame for achieving your objectives.
Depending on how your company or business operates, a Gantt chart may correspond to a quarter. For example, let's say we want to conduct a communication strategy for the launch of a new product. We would then set this chart to start on 1 May and end on 31 July.
It may take longer or require an extension, and that's perfectly fine. However, it is important to define a project end date to work towards. Remember to factor in vacation periods to ensure you accurately allocate time.
Step 2: Add tasks to the Gantt chart
With an end goal in mind, you now need to add and complete the tasks on the Gantt chart. Work with your team to add details to the tasks, color code cards according to department, team, or division, and tag responsible team members.
You will also need to assign a start date and an end date and to stretch the task over the time period. This is incredibly important to ensure that everyone understands the timelines involved so that the overall project remains on track. You can also add all the necessary details for the task. Each task can also be divided into subtasks.
In each team, a project lead or manager should be responsible for assigning different tasks and subtasks to everyone. Each card, depending on the responsible person or team, can have a different color to facilitate the overall understanding of the project plan.
Step 3: Create dependencies between tasks
Many tasks cannot be executed if other tasks have not been carried out beforehand, so their level of dependency will be very high. Using Miro’s Gantt chart template, you can create dependency lines by linking cards together. The project manager or team leader should determine the most important dependencies to prioritize and should discuss this with the relevant people involved.
Step 4: Add milestone markers to provide visibility
Milestone markers, as the name implies, are meant to signify important events or goals in a project plan. The milestone can correspond to phases of a project. You can add these to specify these crucial points in your timeline.
Step 5: Make changes and iterate if necessary
Editing your Gantt chart is not always ideal, as a lot of time and thought goes into planning out the project. Sometimes, however, it's necessary. Fortunately, online Gantt chart tools allow you to make changes much more easily.
When you invite your team to collaborate on your Gantt Chart Template, they’ll be able to view any changes such as tasks completed or new processes added in real-time. Add any relevant files (Office, Google Docs, PDF, JPG, PNG) to keep everything in one place, and use the sticky notes and comments feature to explain and discuss tasks when team members need clarification.
Benefits of using a Gantt chart template
The Gantt chart is one of the most popular and widely used charts in project management, and for good reason. There are several advantages to using a simple Gantt Chart template:
Simplifies complex projects - Gantt charts help you and your team to visually understand a project that may seem complex with many moving parts. It is easier to then align as a team in creating a roadmap to complete tasks and meet deadlines.
Helps with time management - Good planning is key to ensuring milestones are met and that everyone is able to manage their tasks effectively. Using a project Gantt chart template helps with tracking dependencies and ensuring that everyone has a manageable workload in meeting their goals. If it seems that milestones are not realistically achievable, deadlines can be adjusted with proper foresight and planning.
Project tracking happens in one place - One of the greatest advantages of using the Gantt chart is that you can see all your tasks, important details, and milestones in one place. It avoids confusion in having to track information across different platforms or documents.
Improves transparency - There are few things more demotivating than having unrealistic deadlines and expectations. Using a Gantt chart can ensure that everyone is aware of the project’s progress and will reduce the likelihood of miscommunication due to mismatched expectations.
Motivates team members - Knowing how tasks fit into the broader project is motivating because people can better understand how they are contributing to the overall project goals. In addition, creating timelines and planning out milestones makes it easier to manage your individual schedules. Being unable to meet deadlines effectively can be incredibly frustrating and demotivating so using a Gantt chart reduces the likelihood of this happening.
Increased personalization - Using Miro’s Gantt Chart template is synonymous with personalization. You’re able to change the colors and labels, add sticky notes and images, and so much more. Everyone who is involved in the project can see everything clearly.
These are just a few of the benefits of using a Gantt chart for project management. Certainly, there are many more advantages of using Gantt charts that are part of the reason why this powerful tool has become so popular.
Can I share my Gantt chart template?
Yes, invite your team to join you on your board or download your Gantt chart as an image or PDF.
Is the Gantt chart template pre-filled?
Gantt chart templates are not pre-populated with any particular project data. Rather, they are created as frameworks or structures that visually represent a project timeline. You can customize the template by adding your own content and project information, such as tasks, durations, start dates, and dependencies, to create a personalized Gantt chart that is tailored to your specific project.
What is a Gantt chart used for?
People use the Gantt chart to display project progress and tasks, assigned stakeholders, and deadlines in a visual timeline. It helps project managers to track progress easily. Still, any individual contributor can create a Gantt Chart Template and use it to track and organize their own professional and personal projects.
Get started with this template right now.
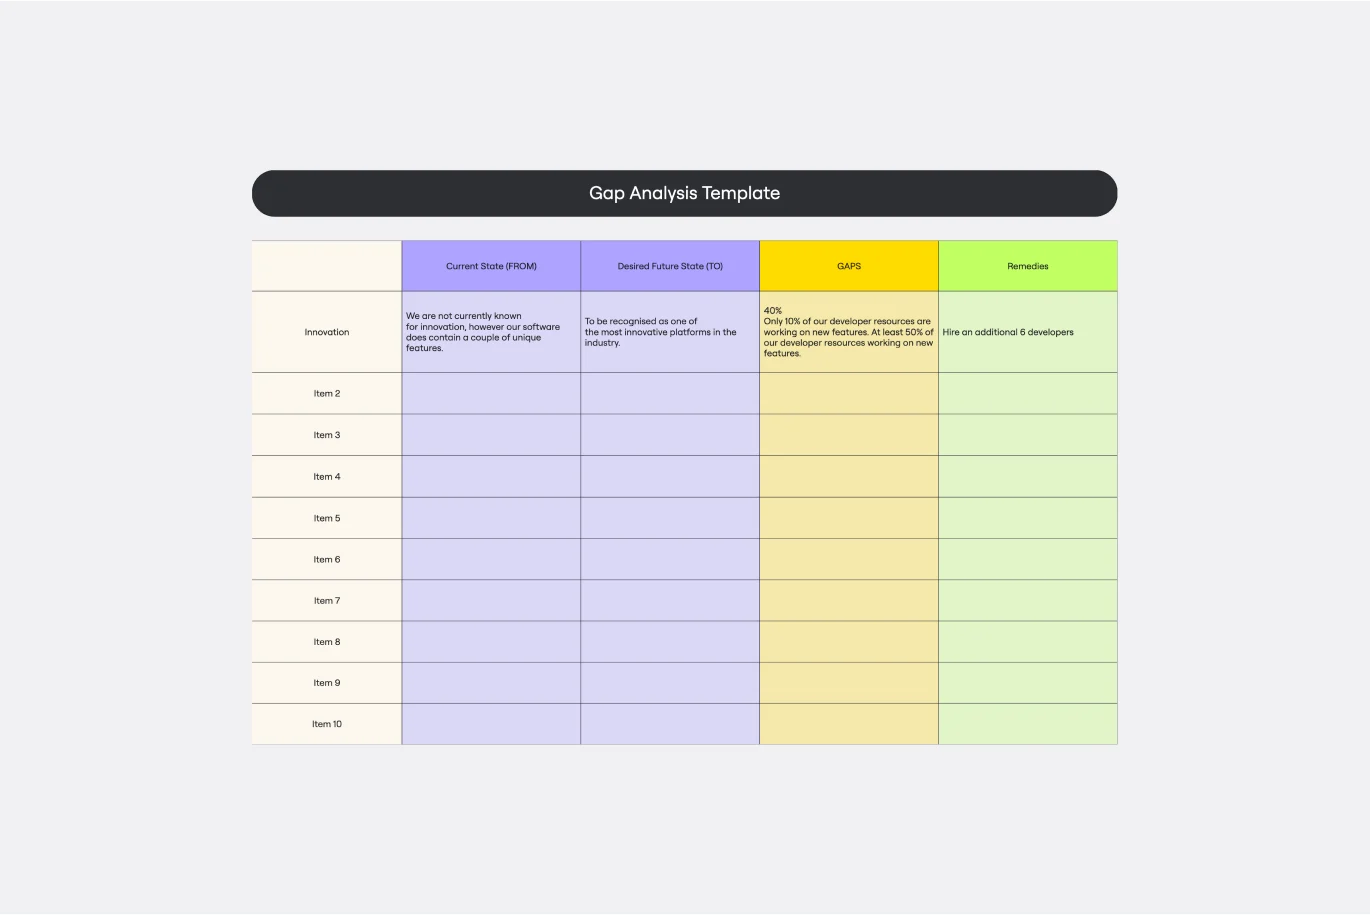
Gap Analysis Template
Works best for:
Marketing, Strategic Planning, Business Management
Consider your team’s or organization’s ideal state. Now compare it to your current real-world situation. Want to identify the gaps or obstacles that stand between your present and future? Then you’re ready to run a gap analysis. This easy-to-customize template will let your team align on what obstacles are preventing you from hitting your goals sooner, collaborate on a plan to achieve those goals, and push your organization toward growth and development. You can focus on specific gap analyses — including for skills, candidates, software, processes, vendors, data, and more.

PI Planning Template
Works best for:
Agile Methodology, Strategic Planning, Software Development
PI planning stands for “program increment planning.” Part of a Scaled Agile Framework (SAFe), PI Planning helps teams strategize toward a shared vision. In a typical PI planning session, teams get together to review a program backlog, align cross-functionally, and decide on the next steps. Many teams carry out a PI planning event every 8 to 12 weeks, but you can customize your planning schedule to fit your needs. Use PI planning to break down features, identify risks, find dependencies, and decide which stories you’re going to develop.
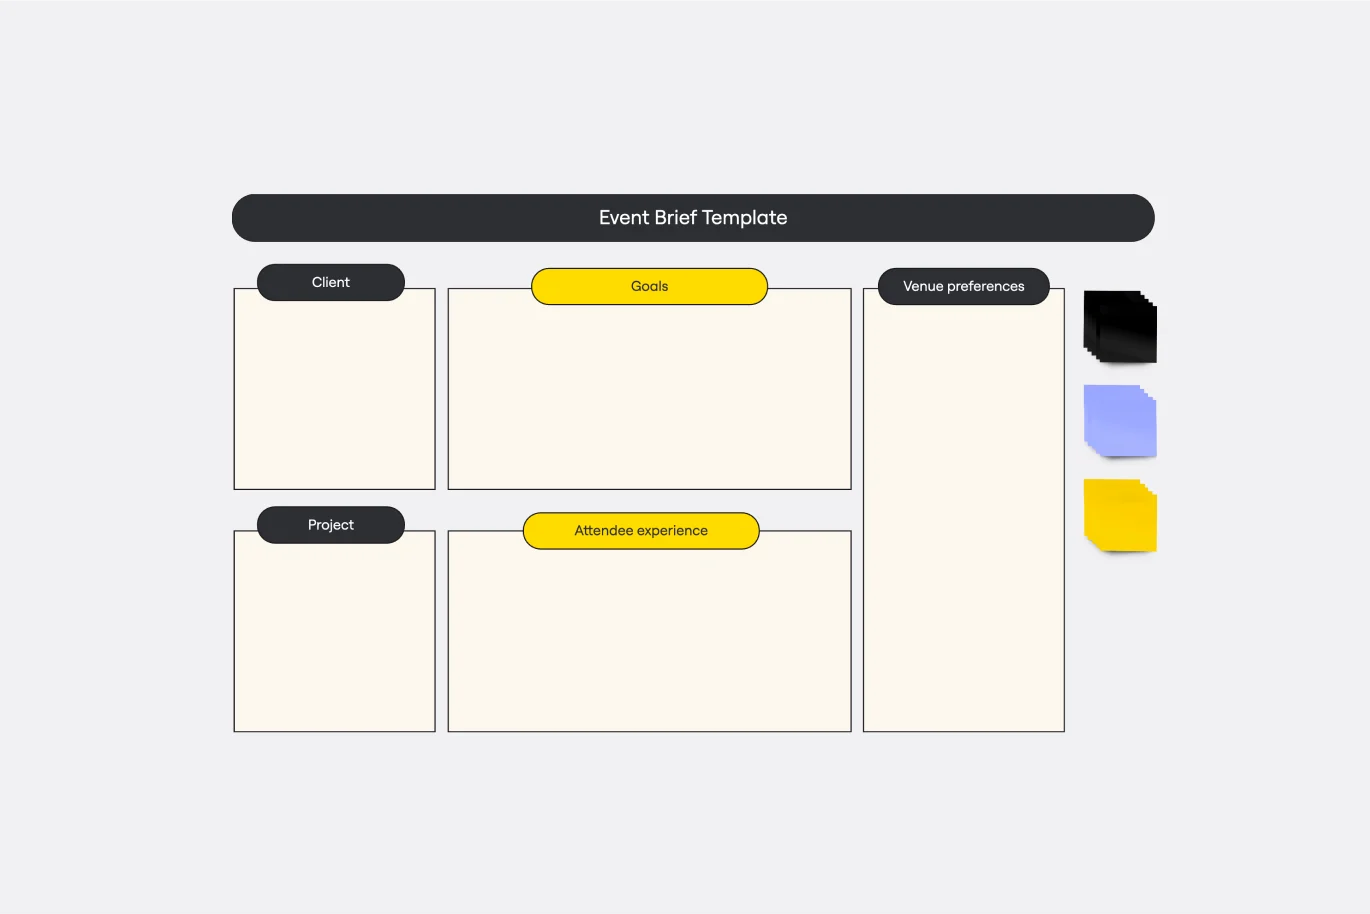
Event Brief Template
Works best for:
Meetings, Workshops, Project Planning
For most any organization, throwing a big deal event is…a big deal. An event can bring in publicity, new clients, and revenue. And planning it can require a substantial chunk of your overall resources. That’s why you’ll want to approach it like a high-stakes project, with clearly outlined goals, stakeholders, timelines, and budget. An event brief combines all of that information in a single source of truth that guides the events team, coordinator, or agency—and ensures the event is well-planned and well-executed.
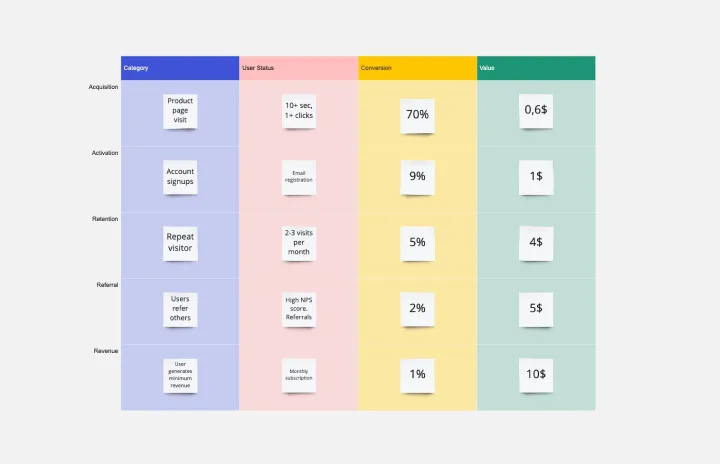
AARRR Template
Works best for:
Marketing, Strategic Planning, Project Planning
Sometimes called “Pirate Metrics” because of the name (go ahead, say it, it’s fun), AARRR is a valuable approach for startups to consider. That’s because AARRR stands for Acquisition, Activation, Retention, Referral, and Revenue—five key types of user behavior that are highly measurable and drive growth. Ask and answer the right questions around each of these five factors, and you’ll be able to establish clear goals and identify the best steps to help reach them.
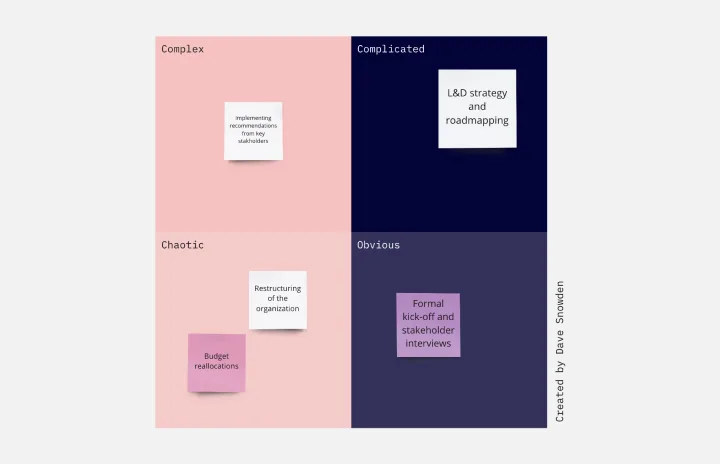
Cynefin Framework Template
Works best for:
Leadership, Decision Making, Prioritization
Companies face a range of complex problems. At times, these problems leave the decision makers unsure where to even begin or what questions to ask. The Cynefin Framework, developed by Dave Snowden at IBM in 1999, can help you navigate those problems and find the appropriate response. Many organizations use this powerful, flexible framework to aid them during product development, marketing plans, and organizational strategy, or when faced with a crisis. This template is also ideal for training new hires on how to react to such an event.
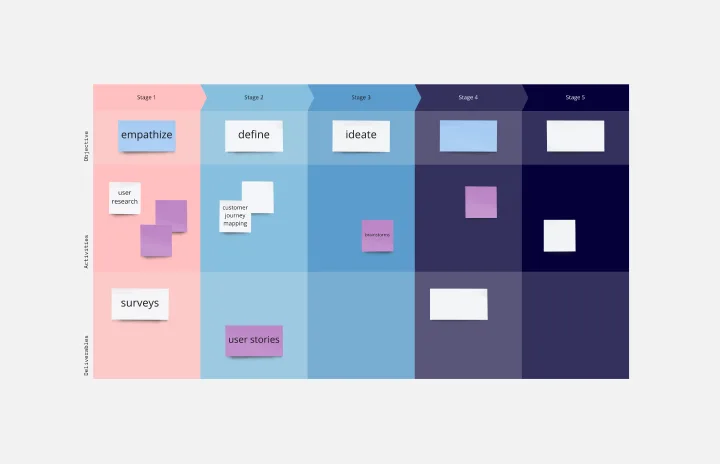
Process Map Template
Works best for:
Agile Methodology, Product Management, Mapping
Process mapping allows you to assess, document, and strategize around any plan or approach your team has put in place. It’s a useful tool for eliminating or preventing blockers. Organized by stages, a process map enables your team to divide up a process or system and record deliverables and action items at each stage of the process. By breaking down the objectives, activities and deliverables at any stage of a project, you can gain insight into whether you are on track or effectively working through a problem.