PERT Chart Template
Track project timelines, tasks, and dependencies at a single glance using a PERT chart template.
Trusted by 65M+ users and leading companies


About the PERT Chart Template
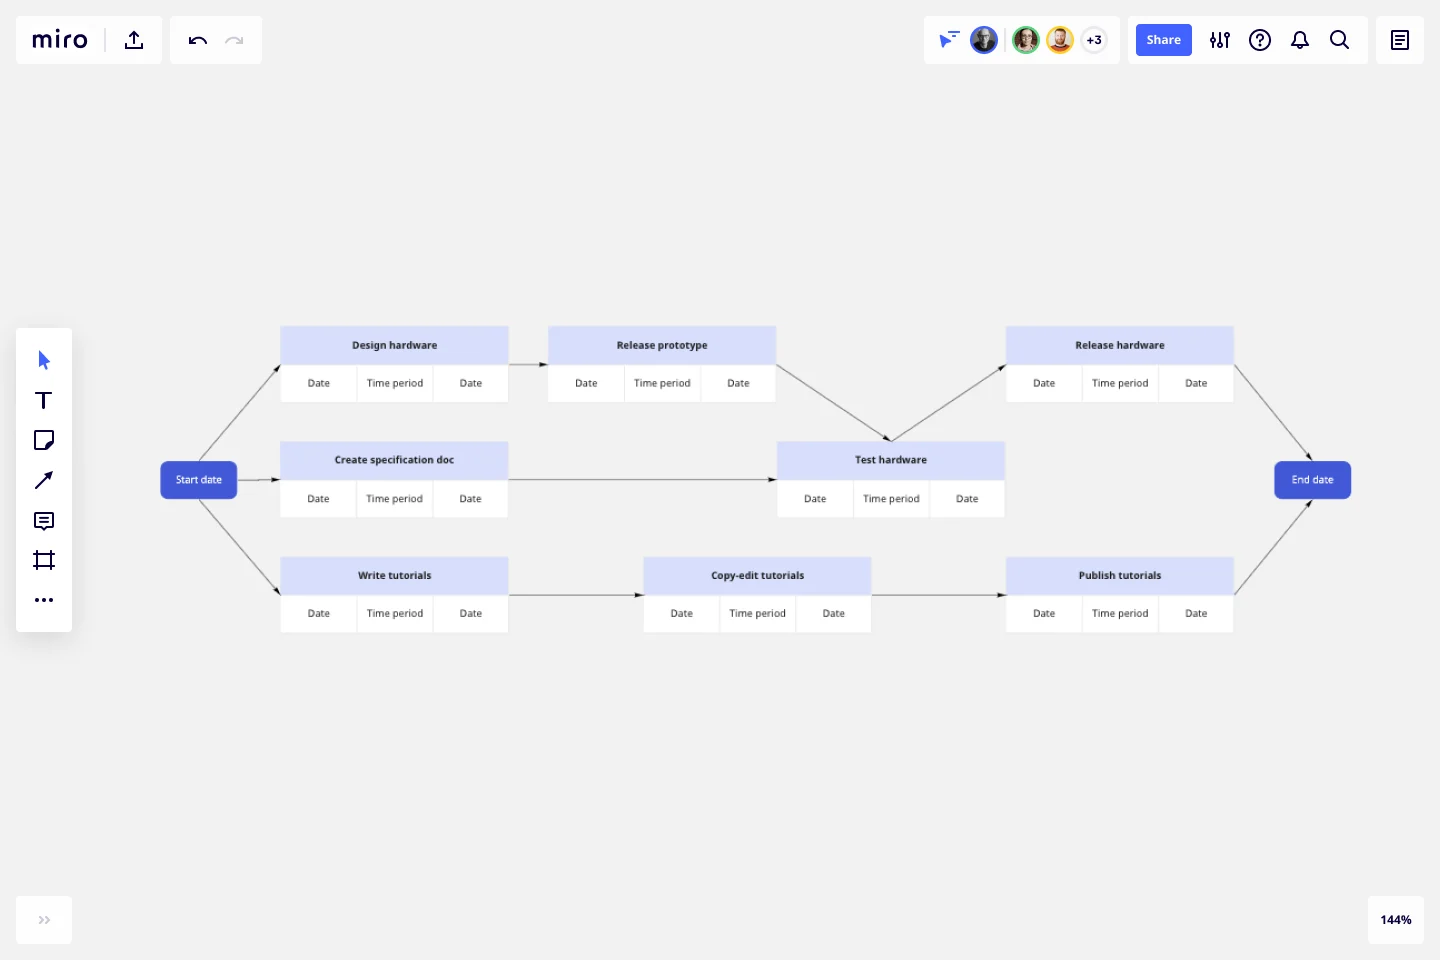
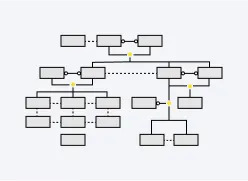
Miro’s PERT chart template is a project management tool that allows you to create a visual roadmap for your project. Designed to let you see interdependencies and to help you identify possible bottlenecks, this template consists of nodes and vectors that are easy to fill out and customize.
We’ll walk you through how to make the most of the PERT chart template.
How to use the PERT chart template
To get started, click on the blue “use template” button to open the PERT chart template in Miro. Once you’re in, follow the steps below to start filling it out.
1. Identify project tasks
Break your project down into tasks. Then, label the blue headers along the nodes with the task names. Double-click on the pre-written text to replace it with your own. Below the blue headers, add each task's expected start and end dates and the estimated durations by double-clicking on the text boxes.
2. List task dependencies
Are there any tasks you can’t start until another one’s been completed first? That means you have dependencies. Use the arrows in the PERT chart template to connect dependent tasks, and make sure the direction represents the order you need to complete them.
4. Label dependencies
Add more detail to clarify the nature of each dependency by labeling the arrows with one of the following:
Finish-to-Start (FS): You can’t start a task until you’ve completed the preceding task.
Start-to-Start (SS): You can start a task as soon as you’ve started its preceding task.
Finish-to-Finish (FF): You can’t finish a task until you’ve completed the preceding task.
Start-to-Finish (SF): You can’t finish a task until you’ve started the preceding task.
Grab text boxes from the toolbar and place them along the arrows to add your labels.
6. Identify a critical path
Use the estimated durations to calculate the critical path. Then, use colors to outline nodes or arrows to visualize it.
7. Share your diagram
Once you’ve filled in the PERT chart template, you can share it with your team and key stakeholders for feedback and easily make changes to your Miro board anytime.
Benefits of using Miro’s PERT chart template
Miro’s PERT chart template makes it especially easy to manage projects that involve multiple team members and stakeholders. With advanced collaboration features at your fingertips, you can easily build a PERT chart together online in real-time or invite others to view and comment on your Miro board when you’re ready — making it an ideal solution for remote and hybrid teams.
The PERT chart template is also fully customizable, allowing you to take advantage of Miro’s extensive editing features — from resizing nodes and text to changing up colors and line thickness.
Is Miro’s PERT chart template free?
Yes, all our templates are free and ready to use. Simply click on the blue “Use template” button to get started.
Can I share the PERT chart template with others outside my team?
Yes, there are several ways to share the PERT chart template. Export your Miro board as a PDF or image to attach it as a file to a message. Alternatively, you can embed your Miro board on other sites or generate a shareable link to send to others.
What is the critical path in a PERT chart?
A critical path shows the longest path of essential tasks you must complete to finish a project. For example, you can't move on to do the upholstery and interior if you haven't finished putting up the walls and roof. When one of these tasks is late, it impacts the entire project. To make up for missed deadlines on critical tasks, reallocate resources and staff from the low-impact tasks.
Get started with this template right now.
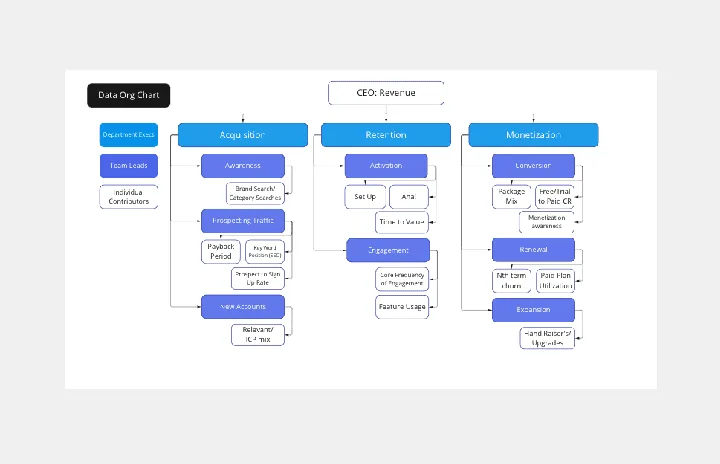
Data Org Chart
Works best for:
Org Charts, Operations, Mapping
Succeed with your data-driven culture by creating a data 'org chart'.
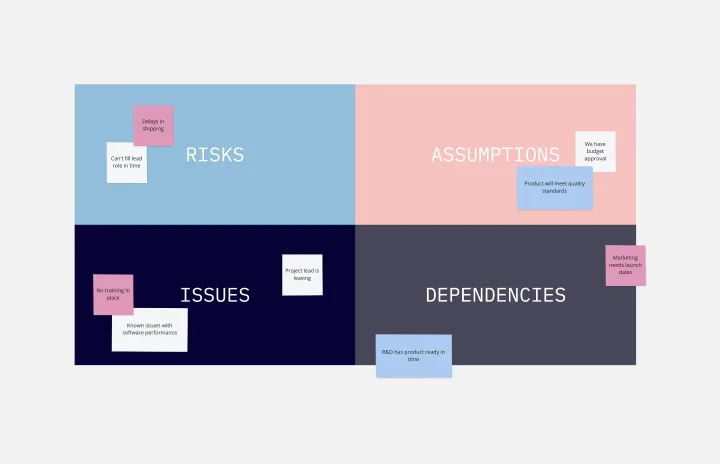
RAID Log Template
Works best for:
Agile Methodology, Project Management, Agile Workflows
Use the RAID Log template to better understand potential risks, assumptions, issues, and dependencies relating to an upcoming project. With this information, you can make effective contingency plans and prepare your resources accordingly. You’ll know what could go wrong throughout the project and how to fix the problem.
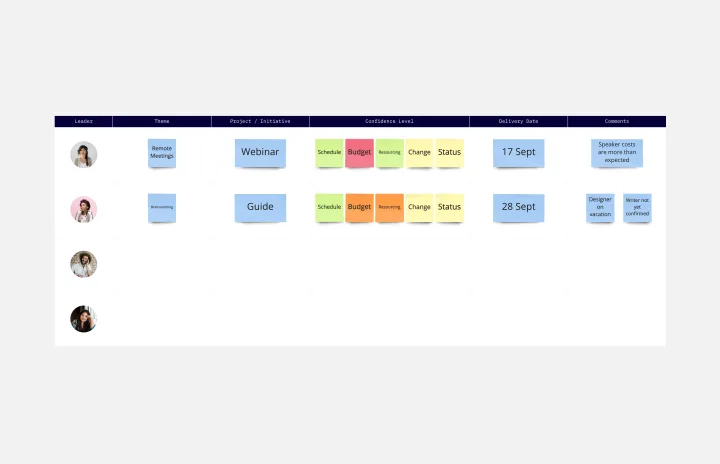
Status Report Template
Works best for:
Project Management, Documentation, Strategic Planning
A status report provides a snapshot of how something is going at a given time. You can provide a status report for a project, a team, or a situation, as long as it emphasizes and maps out a project’s chain of events. If you’re a project manager, you can use this report to keep historical records of project timelines. Ideally, any project stakeholder should be able to look at a status report and answer the question, “Where are we, and how did we get here?” Use this template as a starting point to summarize how something is progressing against a projected plan or outcome.
Lesson Plan Template
Works best for:
Education
Use the Lesson Plan to inform everyone about assignments, get clarity when planning lessons, and align your student’s expectations. Many educators use the Lesson Plan template to organize their teaching material and assess learning experiences and insights into students’ progress and interests. The Lesson Plan is an excellent tool for giving students an overview of the learning plan and connecting deeper with the topics and the study sessions.
Family Tree Template
Works best for:
Education, Mapping
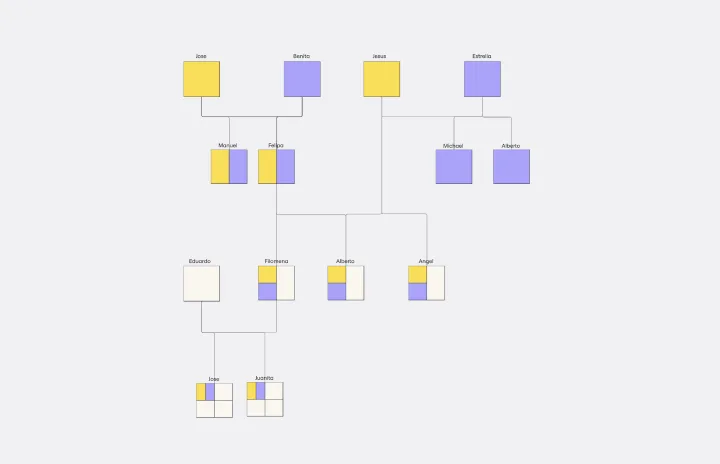
Family trees help you make sense of complicated family relationships, even generations back. With this Family Tree Template, you can quickly and easily add your siblings, parents, and extended family members. Plus, add extra information, notes, and even images to create a vibrant family tree.
Genogram Template
Works best for:
Diagramming
The Genogram Template maps out family structures and relationships with exceptional depth and detail. Unlike traditional family trees, this template provides a comprehensive perspective by encapsulating familial connections, emotional ties, and significant life events. Create a genogram to unearth patterns and trends within a family, whether hereditary or environmental. Professionals across different domains can gain a holistic understanding of familial dynamics by showing deep insights into the nuances of relationships, facilitating better communication and problem-solving.