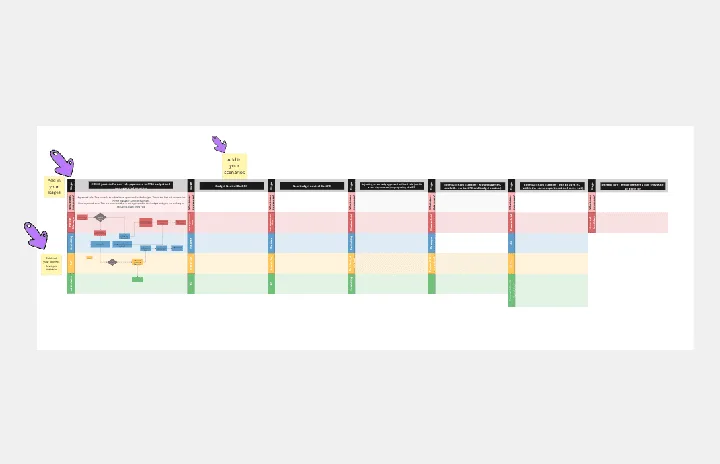
Impact Mapping Template
Set business goals and outline how to achieve them.
Trusted by 65M+ users and leading companies


About the Impact Mapping template
What is Impact Mapping?
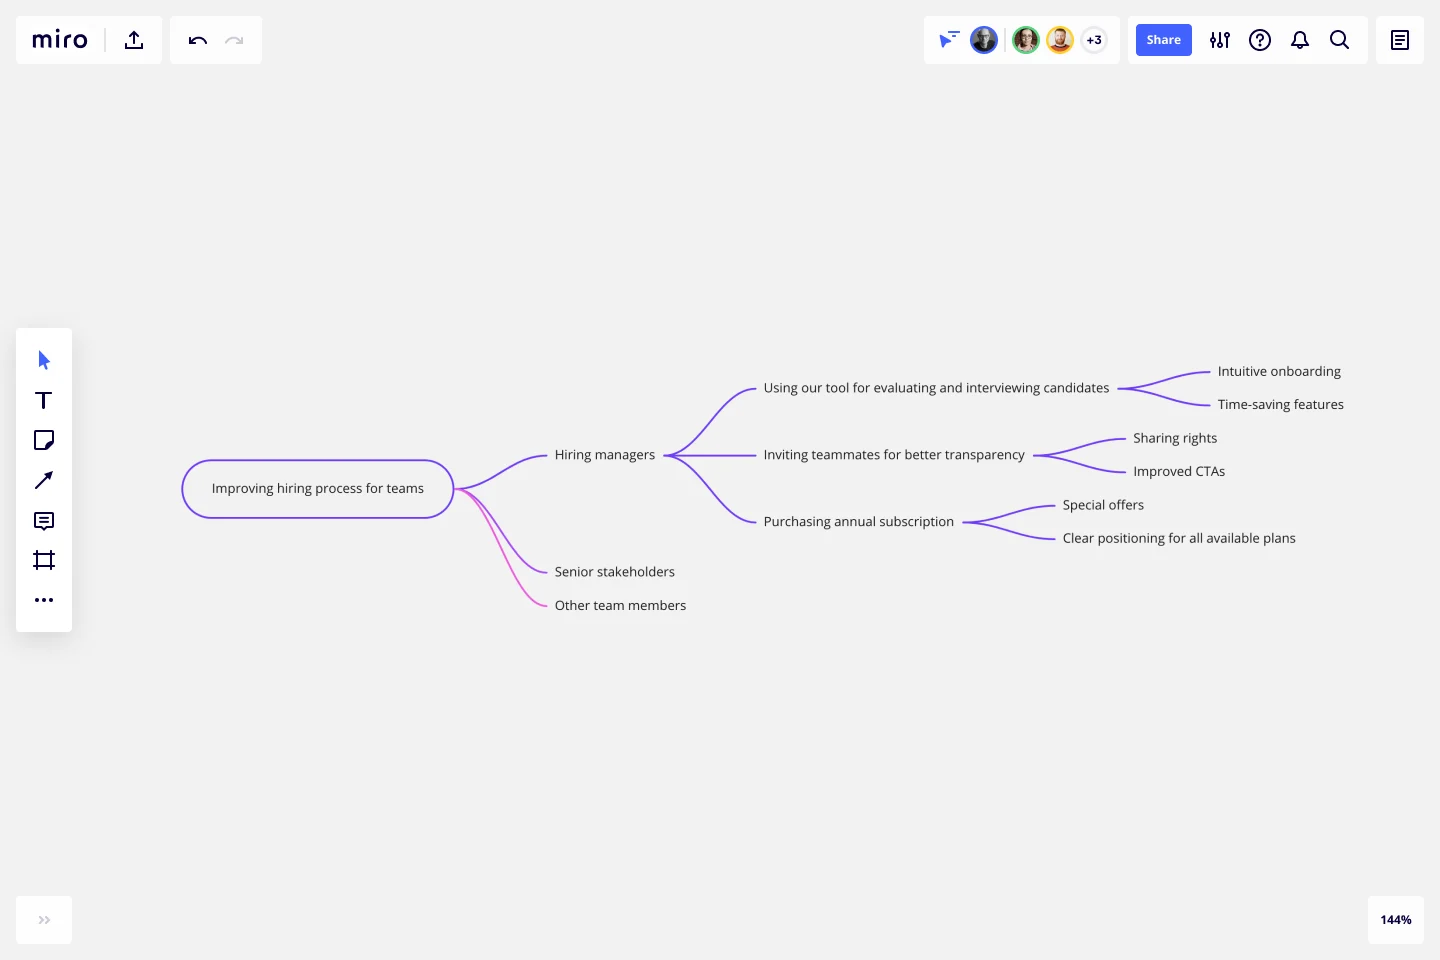
Impact mapping is a strategic planning technique. It allows organizations to stay on track while building products and shipping goods and services. An impact map is a graphical representation of your goals and the steps you must take to deliver on them. By creating an impact map, you can clearly communicate with your teammates, align on business objectives, and build better roadmaps.
When building products or working on projects, it can be easy to lose sight of your role within the broader organization. But your projects have a dynamic relationship with everything else in the organization, including other projects, teams, products, and functions. Many planning techniques lack this big-picture view. Impact maps, by contrast, help you visualize the relationship between your project roadmaps and the rest of your organization. You can therefore capture key assumptions and scope so you can deliver solutions without waste or over-engineering.
When should you use Impact Mapping?
You can use Impact Mapping to help you decide what should be in a product, prove to a client that it’s not worth investing in a particular feature and plan your next sprint or release. You can also use Impact Mapping for any type of project planning.
What are the key steps of Impact Mapping?
Impact Mapping is generally broken into 4 key steps: setting and describing business goals, identifying the personas, defining the actions these personas will take, and brainstorming the deliverables that will prompt these actions to take place.
How do you create an Impact Map?
Creating an impact map is simple and easy to do if you follow these steps. You can use our Impact Mapping Template and discuss everything with your team in real-time using Miro’s virtual collaboration platform.
Step 1: Decide on your goals
Start by drawing a box that contains your goal. Why are we doing this project? What do we hope to achieve?
Step 2: Identify the actors
Draw a branch that links your goal to your next box: the actors. Who can produce the effect we’re looking for? Who can obstruct who? Who are our customers or users? Who will be impacted by our goal? Many people choose to have a box for each actor. Connect each box to your goal.
Step 3: Determine the impacts or actions
The second branch brings the impact of your goal into sharper focus. How should our actors’ behavior change as a result of this goal? How can they help us achieve our goal? How might they prevent us from achieving our goal? Draw a box for each potential impact and connect them to your actors.
Step 4: Define the deliverables
Once you have answered those questions, you can start thinking about the scope of your project. The third branch of the map deals with deliverables. What can we do to increase the likelihood that this goal will be achieved? How do we support the desired impact? These are your deliverables -- what you can hope to achieve within the scope of this project.
Get started with this template right now.
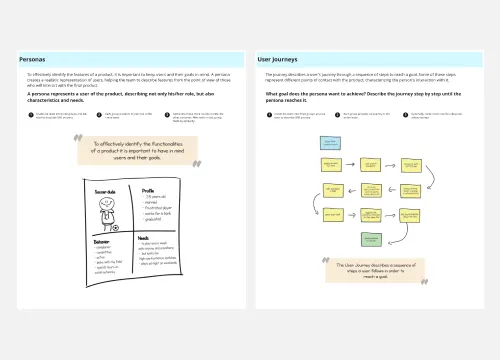
Lean Inception Workshop
Works best for:
Agile, Lean Methodology
The Lean Inception Workshop streamlines project kickoff by aligning teams on goals, scope, and priorities. It leverages Lean principles to eliminate waste and maximize value, guiding exercises to define user personas, map user journeys, and prioritize features. By fostering cross-functional collaboration and customer-centric thinking, this template accelerates project initiation and ensures alignment between stakeholders, empowering teams to deliver customer value faster.
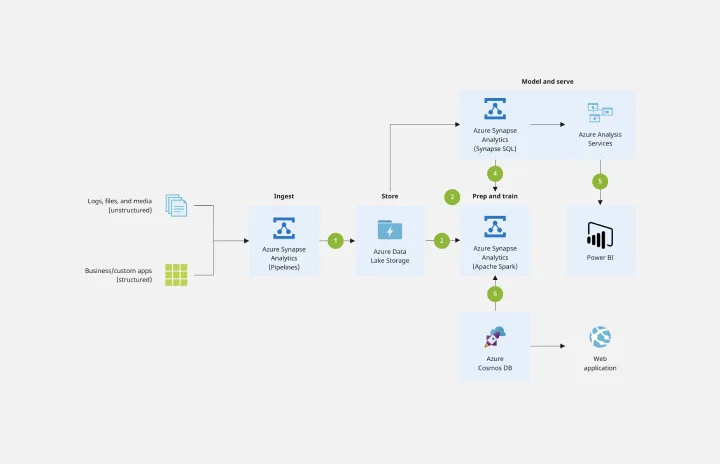
Azure Data Flow Template
Works best for:
Software Development, Diagrams
The Azure Data Flow is a diagram that will allow you to combine data and build and deploy custom machine learning models at scale. Azure is Microsoft’s cloud computing platform, designed to provide many cloud-based services like remote storage, database hosting, and centralized account management. Azure also offers new capabilities like AI and the Internet of Things (IoT).
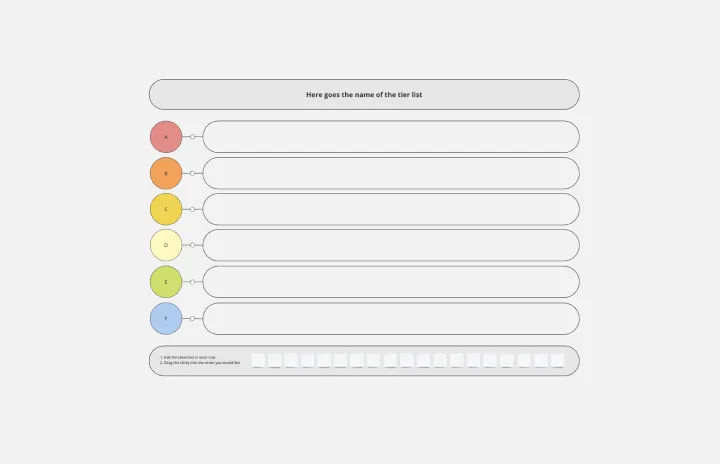
Tier List Template
Works best for:
Graphs
A Tier List Template is a ranking tool that allows teams to organize different items into specific categories, or "tiers," based on their significance, quality, or performance. This template is a visual tool that aids in making decisions and prioritizing tasks. Use it to power your brainstorming, strategic meetings, and planning.
Headcount Approval Process Flowchart
Works best for:
Flowcharts, Mapping, Diagrams
The Headcount Approval Process Flowchart template offers a visual framework for illustrating the steps and stages involved in the headcount approval process within an organization. It provides a structured framework for documenting approval workflows, roles, and decision points. This template enables HR professionals and managers to streamline the headcount approval process, ensure compliance, and improve transparency and accountability. By promoting clarity and efficiency, the Headcount Approval Process Flowchart empowers organizations to manage their workforce effectively and make informed staffing decisions.
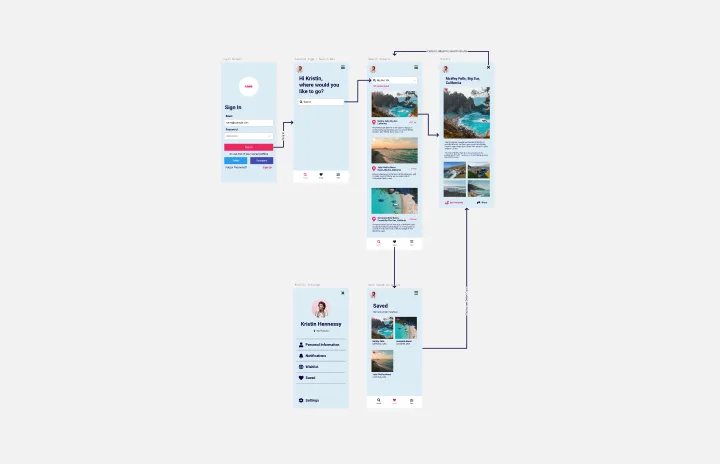
Prototype Template
Works best for:
UX Design, Design Thinking
A prototype is a live mockup of your product that defines the product’s structure, user flow, and navigational details (such as buttons and menus) without committing to final details like visual design. Prototyping allows you to simulate how a user might experience your product or service, map out user contexts and task flows, create scenarios to understand personas, and collect feedback on your product. Using a prototype helps you save money by locating roadblocks early in the process. Prototypes can vary, but they generally contain a series of screens or artboards connected by arrows or links.
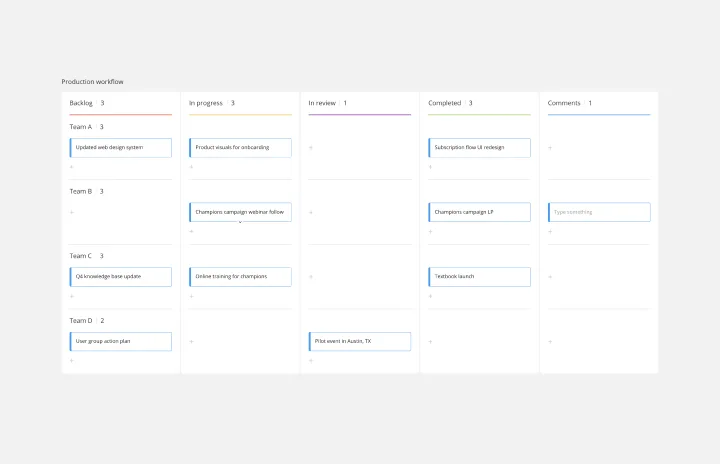
Production Workflow Template
Works best for:
Agile Workflows, Agile Methodology, Project Management
Whether you’re producing a podcast, a marketing campaign, a TV show, or a piece of content, establishing a production workflow is crucial. A production workflow creates a visual guide to the different steps in a process. It can be used to train new team members or give a high-level overview to stakeholders. Although production workflows vary by team and business, they generally contain information about who the stakeholders are, how you brainstorm ideas, what your timeline looks like, and what resources you need to succeed.