Google Cloud Architecture Diagram Template
Visualize the deployment of your applications with Google Cloud Architecture Diagram template and optimize your processes.
Trusted by 65M+ users and leading companies


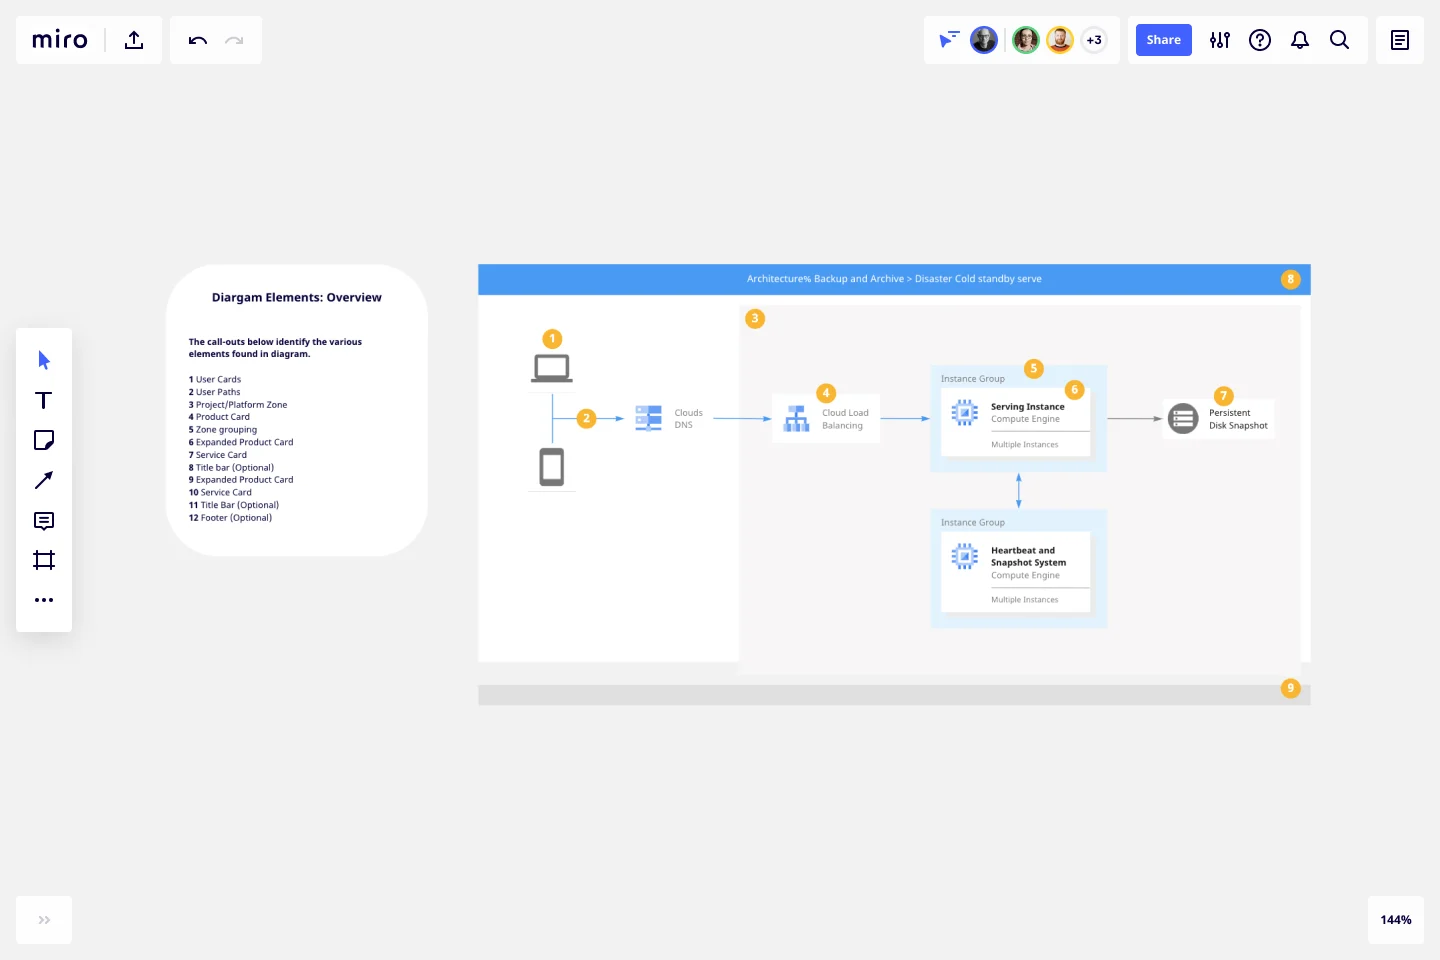
About the Google Cloud Architecture Diagram Template
A Google Cloud Architecture Diagram template is where you can visually represent and manage application development, deployment, and documentation. You can use this Google Cloud Architecture Diagram template to stay in sync with your team, have an excellent application architecture overview, and quickly iterate if needed.
Keep reading to learn more about the Google Cloud Architecture Diagram Template.
GCP Architecture diagram for network optimization
Developers and IT managers use the Google Cloud Architecture Diagram template to make changes and accurately document the network infrastructure.
The GCP Architecture Diagram also allows people to quickly understand your Google Cloud architecture’s network design and operation, facilitating communication across your organization.
How do I create a Google Cloud Architecture Diagram template?
A Google Cloud Architecture Diagram template allows you to visualize the management of apps.
To create a basic Google Cloud Architecture Diagram template with Miro, you can follow these steps:
List your Google Cloud Architecture components, using our set of Google Cloud Icons.
Organize your diagram by adding in the components of the network..
Add connection lines between the component shapes and set the arrows in the direction of the flow.
Format and customize your Google Cloud Architecture Diagram template with shapes and frames.
In Miro, you can quickly build a GCP Diagram from scratch using our design tools and icons set, or use our Google Cloud Architecture Diagram template and customize it as you see fit.
If you are interested in creating other network diagrams, Miro is the perfect network diagram tool with several available shape packs and templates to suit your needs.
What is Google Cloud Platform used for?
The Google Cloud Platform is used to make network management and development of network infrastructure accessible and flexible, allowing organizations to create cloud-native apps and manage and analyze data quickly. The Google Cloud Platform helps you navigate many services categories from computer networks to storage and database.
How do I draw a Google cloud architecture?
There are many ways you can draw a Google Cloud Architecture Diagram with Miro. You can either use our template or draw your GCP diagram from scratch. Follow these steps to draw your Google Cloud Architecture Diagram in Miro: select which GCP icons to use for your diagram from Miro’s Google Cloud Platform component library. Next, use connector lines and other shapes to outline and describe your network, and lastly, add arrows to represent the flow of information.
Get started with this template right now.
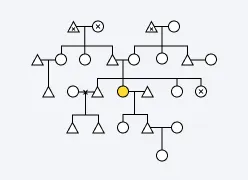
Kinship Diagram Template
Works best for:
Mapping
Use a Kinship Diagram Template to map out a clear picture of your family relationships. With clear guidelines for kinship notation, you can navigate everything from your closest uncle to your third cousin twice removed. Try the Kinship Diagram Template to understand your family relationships.
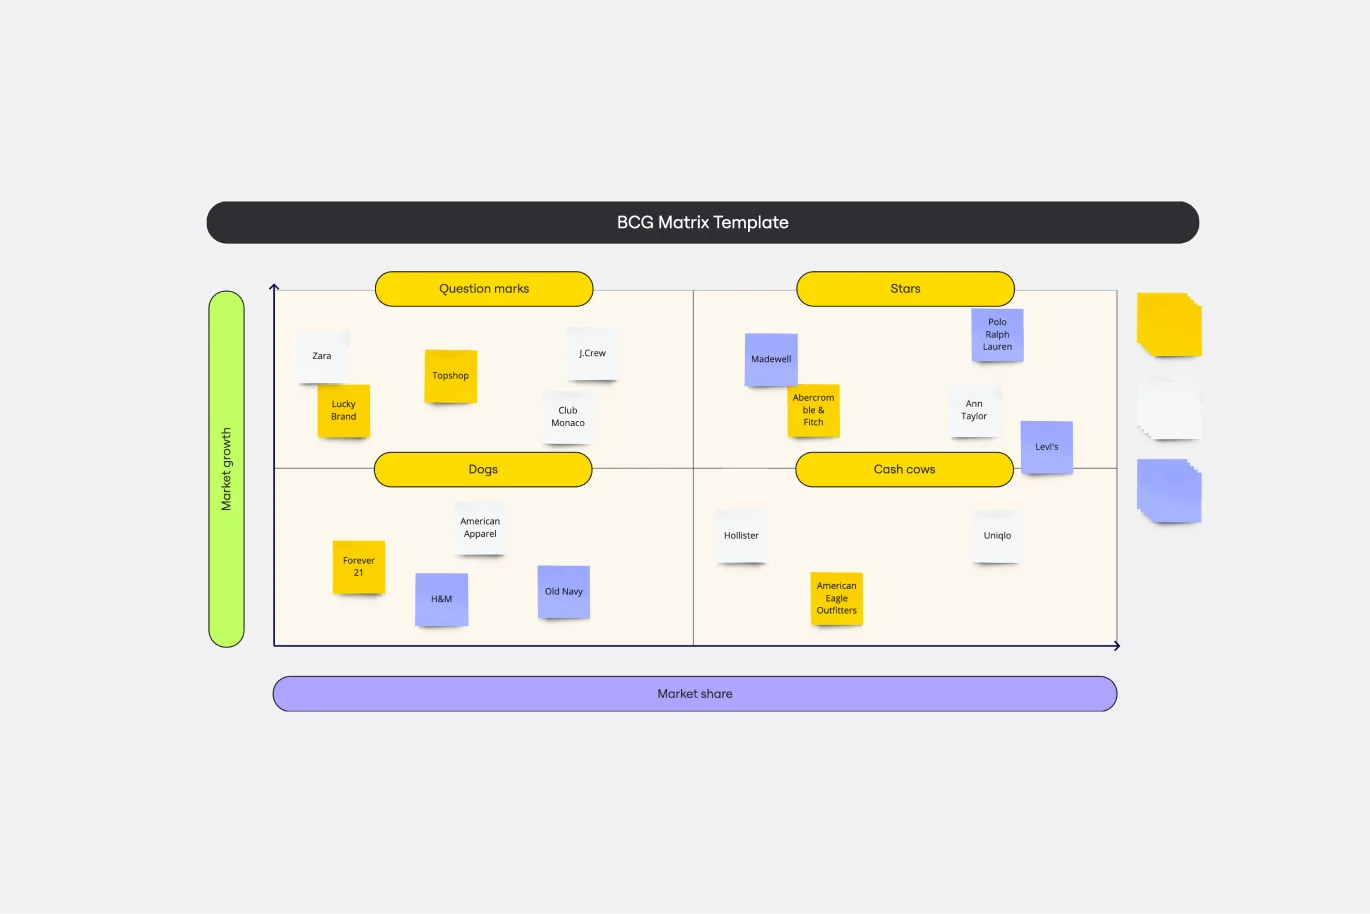
BCG Matrix Template
Works best for:
Strategic Planning
Use the BCG matrix template to make informed and strategic decisions about growth opportunities for your business. Assign your portfolio of products to different areas within the matrix (cash cows, dogs, question marks, stars) to prioritize where you should invest your time and money to see the best results.
Cost-Benefit Analysis Template
Works best for:
Leadership, Decision Making, Strategic Planning
With so many day-to-day decisions to make—and each one feeling high-stakes—it’s easy for all the choices to weigh a business or organization down. You need a systematic way to analyze the risks and rewards. A cost benefit analysis gives you the clarity you need to make smart decisions. This template will let you conduct a CBA to help your team assess the pros and cons of new projects or business proposals—and ultimately help your company preserve your precious time, money, and social capital.

Onion Diagram Template
Works best for:
Diagramming, Mapping and Diagramming
The Onion Diagram Template is a distinct tool designed to visually represent layers of a specific concept, system, or process, akin to the layers of an onion. Each concentric layer of the diagram provides insights into a different aspect or phase of the topic at hand, moving from the core foundational element outwards to more peripheral components. One of the prime benefits of this template is its ability to offer hierarchical clarity. Users can immediately discern the importance, sequence, or interrelation of different elements within a system, facilitating enhanced comprehension and efficient decision-making.
Portfolio Template
Works best for:
Presentations, UX Design
The portfolio template is a way for you to showcase your best work in a visual manner. Think of your work portfolio as a way to present who you are as a professional and describe with more detail what you have achieved and what is your unique expertise. You will use a portfolio template as a way to market yourself to future employers when applying for jobs, universities, and training programs.
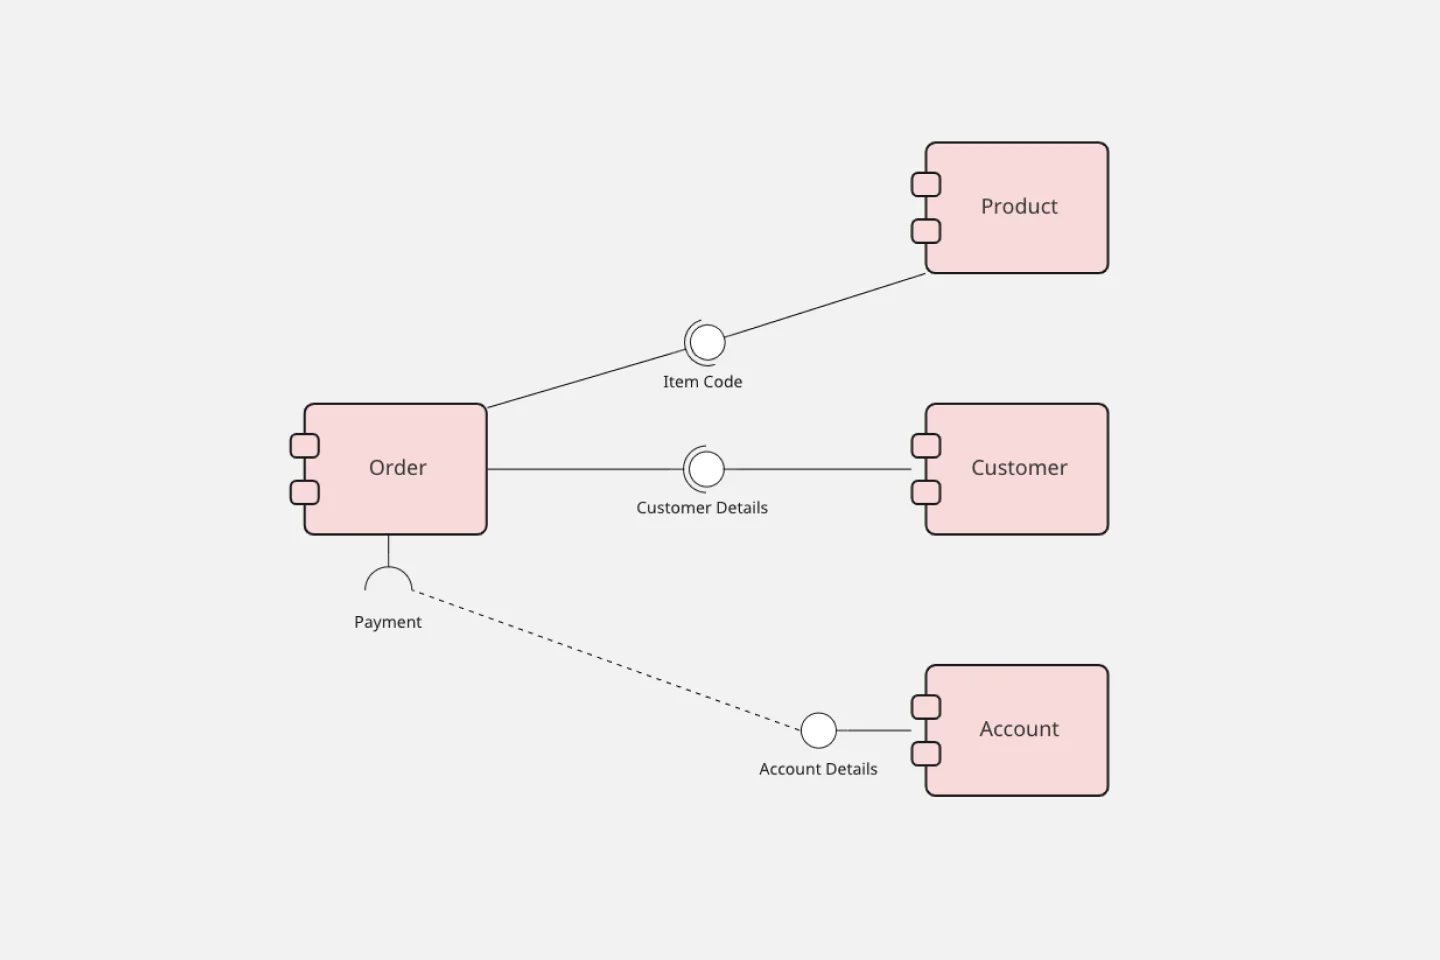
UML Component Diagram Template
Works best for:
Mapping, Diagrams, Software Development
Use our Component Diagram template to show how a system’s physical components are organized and wired together. Visualize implementation details, make sure planned development matches system needs, and more — all in a collaborative environment.