Google Cloud Architecture Diagram Template
Visualize the deployment of your applications with Google Cloud Architecture Diagram template and optimize your processes.
Trusted by 65M+ users and leading companies


About the Google Cloud Architecture Diagram Template
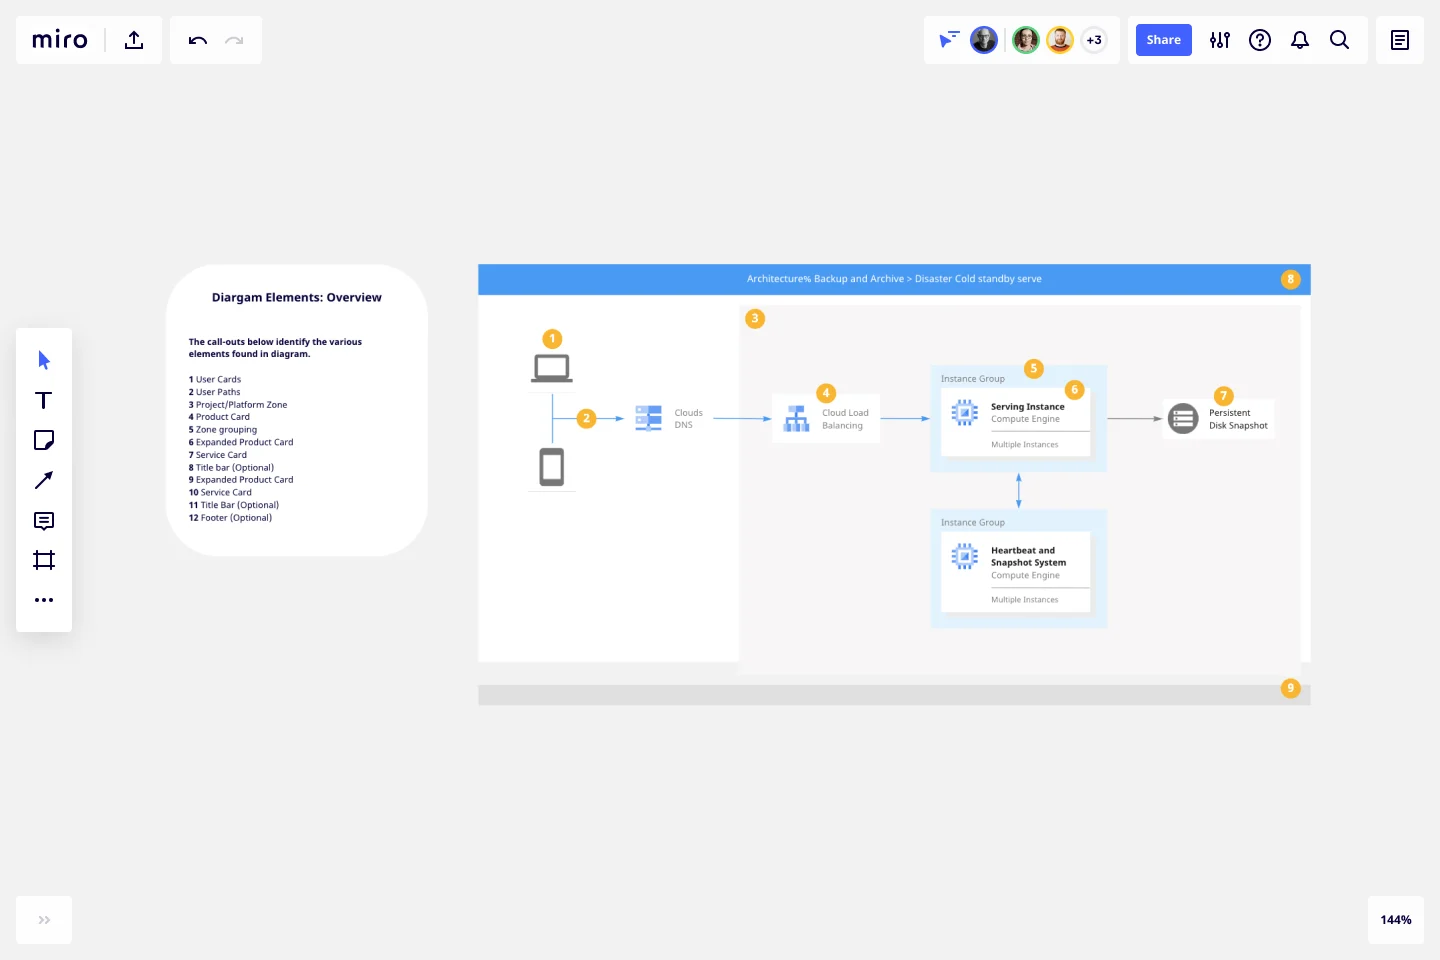
A Google Cloud Architecture Diagram template is where you can visually represent and manage application development, deployment, and documentation. You can use this Google Cloud Architecture Diagram template to stay in sync with your team, have an excellent application architecture overview, and quickly iterate if needed.
Keep reading to learn more about the Google Cloud Architecture Diagram Template.
GCP Architecture diagram for network optimization
Developers and IT managers use the Google Cloud Architecture Diagram template to make changes and accurately document the network infrastructure.
The GCP Architecture Diagram also allows people to quickly understand your Google Cloud architecture’s network design and operation, facilitating communication across your organization.
How do I create a Google Cloud Architecture Diagram template?
A Google Cloud Architecture Diagram template allows you to visualize the management of apps.
To create a basic Google Cloud Architecture Diagram template with Miro, you can follow these steps:
List your Google Cloud Architecture components, using our set of Google Cloud Icons.
Organize your diagram by adding in the components of the network..
Add connection lines between the component shapes and set the arrows in the direction of the flow.
Format and customize your Google Cloud Architecture Diagram template with shapes and frames.
In Miro, you can quickly build a GCP Diagram from scratch using our design tools and icons set, or use our Google Cloud Architecture Diagram template and customize it as you see fit.
If you are interested in creating other network diagrams, Miro is the perfect network diagram tool with several available shape packs and templates to suit your needs.
What is Google Cloud Platform used for?
The Google Cloud Platform is used to make network management and development of network infrastructure accessible and flexible, allowing organizations to create cloud-native apps and manage and analyze data quickly. The Google Cloud Platform helps you navigate many services categories from computer networks to storage and database.
How do I draw a Google cloud architecture?
There are many ways you can draw a Google Cloud Architecture Diagram with Miro. You can either use our template or draw your GCP diagram from scratch. Follow these steps to draw your Google Cloud Architecture Diagram in Miro: select which GCP icons to use for your diagram from Miro’s Google Cloud Platform component library. Next, use connector lines and other shapes to outline and describe your network, and lastly, add arrows to represent the flow of information.
Get started with this template right now.

Causal Loop Diagrams (1.0)
Works best for:
Diagramming
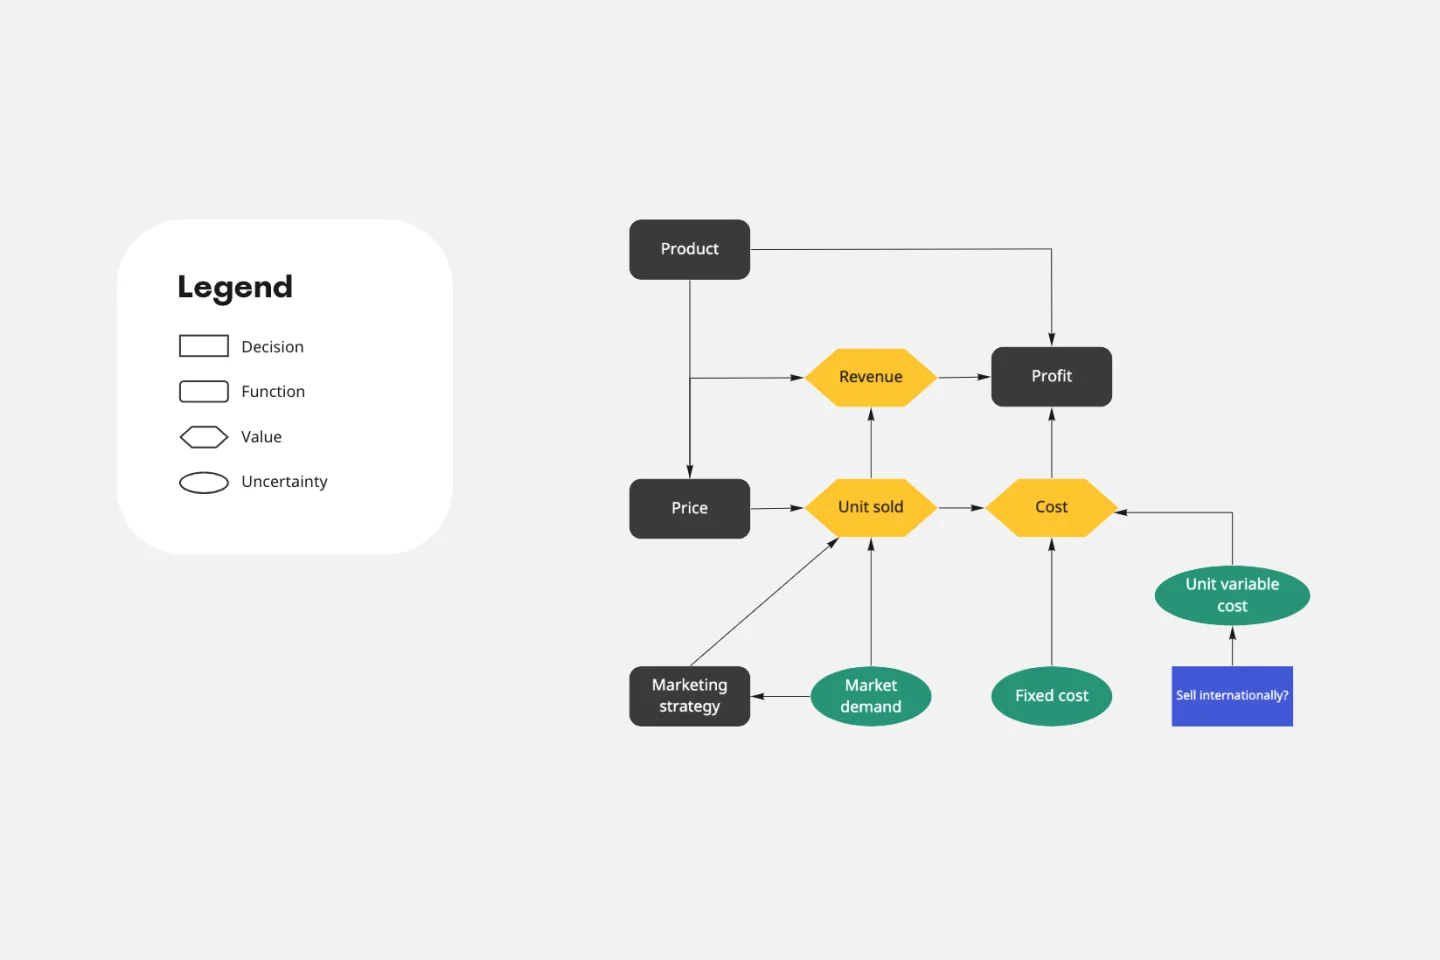
The Causal Loop Diagrams (1.0) template offers a visual tool for modeling complex systems and understanding the feedback loops that drive behavior. It provides a structured framework for identifying causal relationships, reinforcing loops, and balancing feedback within a system. This template enables teams to analyze system dynamics, anticipate unintended consequences, and formulate effective strategies for intervention. By promoting systems thinking and understanding of interdependencies, Causal Loop Diagrams empower organizations to navigate complexity and drive sustainable change.

Driver Diagram Template
Works best for:
Diagramming
The driver diagram template is a strategic visual tool that helps teams map out their primary objectives and break them down into actionable components. It presents goals, drivers, and specific change ideas in a coherent and interconnected format, ensuring clarity of objective. By doing so, every team member is aligned towards a common endpoint, fostering unified efforts. The visual nature of the template simplifies complex objectives, making it easier for teams to stay on track and measure their progress effectively.
Influence Diagram Template
Works best for:
Business Management, Decision Making, Diagrams
See the big picture of any business decision with this Influence Diagram Template. You’ll define the decision you have to make and brainstorm everything that could impact it. When you build connections between these factors, you’ll be able to put the right amount of weight into each one as you make your decision.

UML State Machine Diagram Template
Works best for:
Software Development, Mapping, Diagrams
Visualize the workflow of a process and how objects perform actions based on different stimuli. State machine diagrams are valuable for understanding how an object responds to events at the different stages of its life cycle. They are also helpful for visualizing event sequences in a system.
VRIO Analysis Template
Works best for:
Diagramming, Strategy
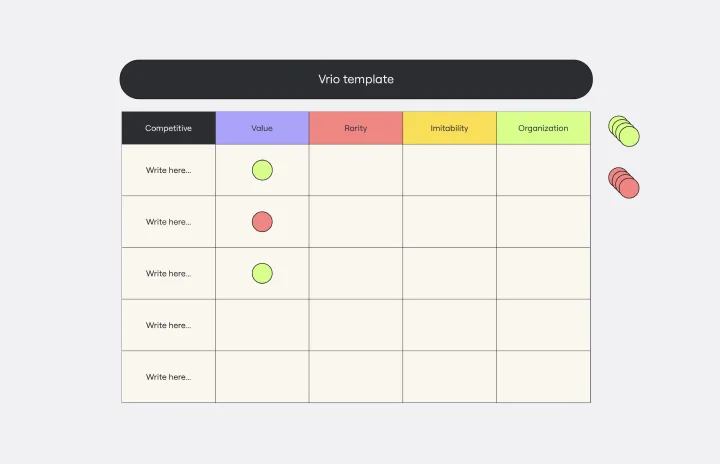
The VRIO Analysis Template is a framework that helps businesses evaluate their resources and capabilities for competitive advantage. It categorizes resources into four areas: Value, Rarity, Imitability, and Organization. This provides a comprehensive view of an organization's strengths and potential weaknesses. The template has the key benefit of offering quick visual insights. Decision-makers can immediately identify and focus on resources that are valuable, rare, hard to imitate, and well-organized. This ensures a sustainable competitive edge and saves time by avoiding lengthy textual analyses.
Cisco Recommended Security Architecture Template
Works best for:
Software Development, Diagrams
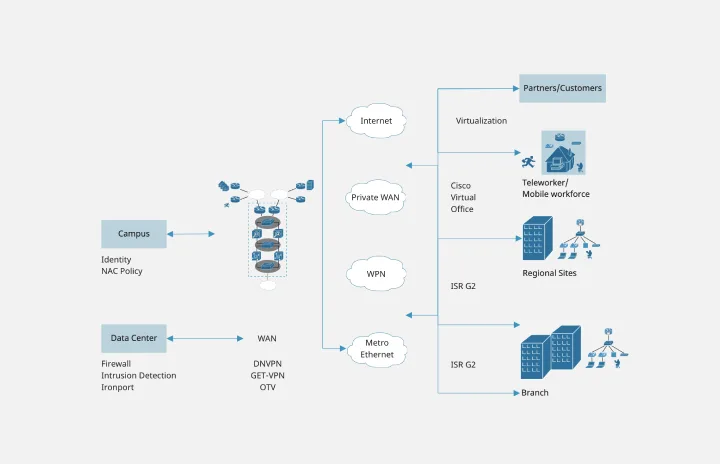
Cisco offers data center and access networking solutions built for scale with industry-leading automation, programmability, and real-time visibility. The Cisco Recommended Security Architecture uses Cisco elements to visually show the network design of Cisco networks.